Analytics
After releasing an app, it's important to understand how the app is performing. To help with this, Canva tracks metrics about an app's performance and makes these metrics available through the Developer Portal.
This page explains the available metrics and how to interpret the data.
Viewing analytics
You can find the analytics for an app in the Developer Portal on the app's Analytics page. By default, this page is disabled. The page becomes available once the app has been released.
What Canva tracks
The Analytics page provides the following metrics:
- App listing views
- App installations
- App usage
This section explains the meaning of each metric.
App listing views
An app listing view occurs when a user views an app's installation screen in the Canva editor.
When a user views an app's details in the Apps Marketplace(opens in a new tab or window), it does not count as an app listing view. In this case, a view is only counted if the user clicks the Use in design button.
The best way to increase app listing views is to get featured in the Apps Marketplace.
App installations
An app installation occurs when a user clicks the Open button on an app's installation screen.
A user uninstalling an app does not decrease the total number of installations. However, if the same user reinstalls the app within 30 days, the installation is not counted twice.
App usage
An app usage is a metric that captures how many unique users are using an app. What counts as a usage might change as the Apps SDK evolves, but some examples of usages include:
- adding an element to a design
- uploading an asset to the user's media library
- exporting a design
This is the same metric used to determine how much an app earns through Canva's Innovation Fund. To learn more, see User adoption calculation.
Interpreting the data
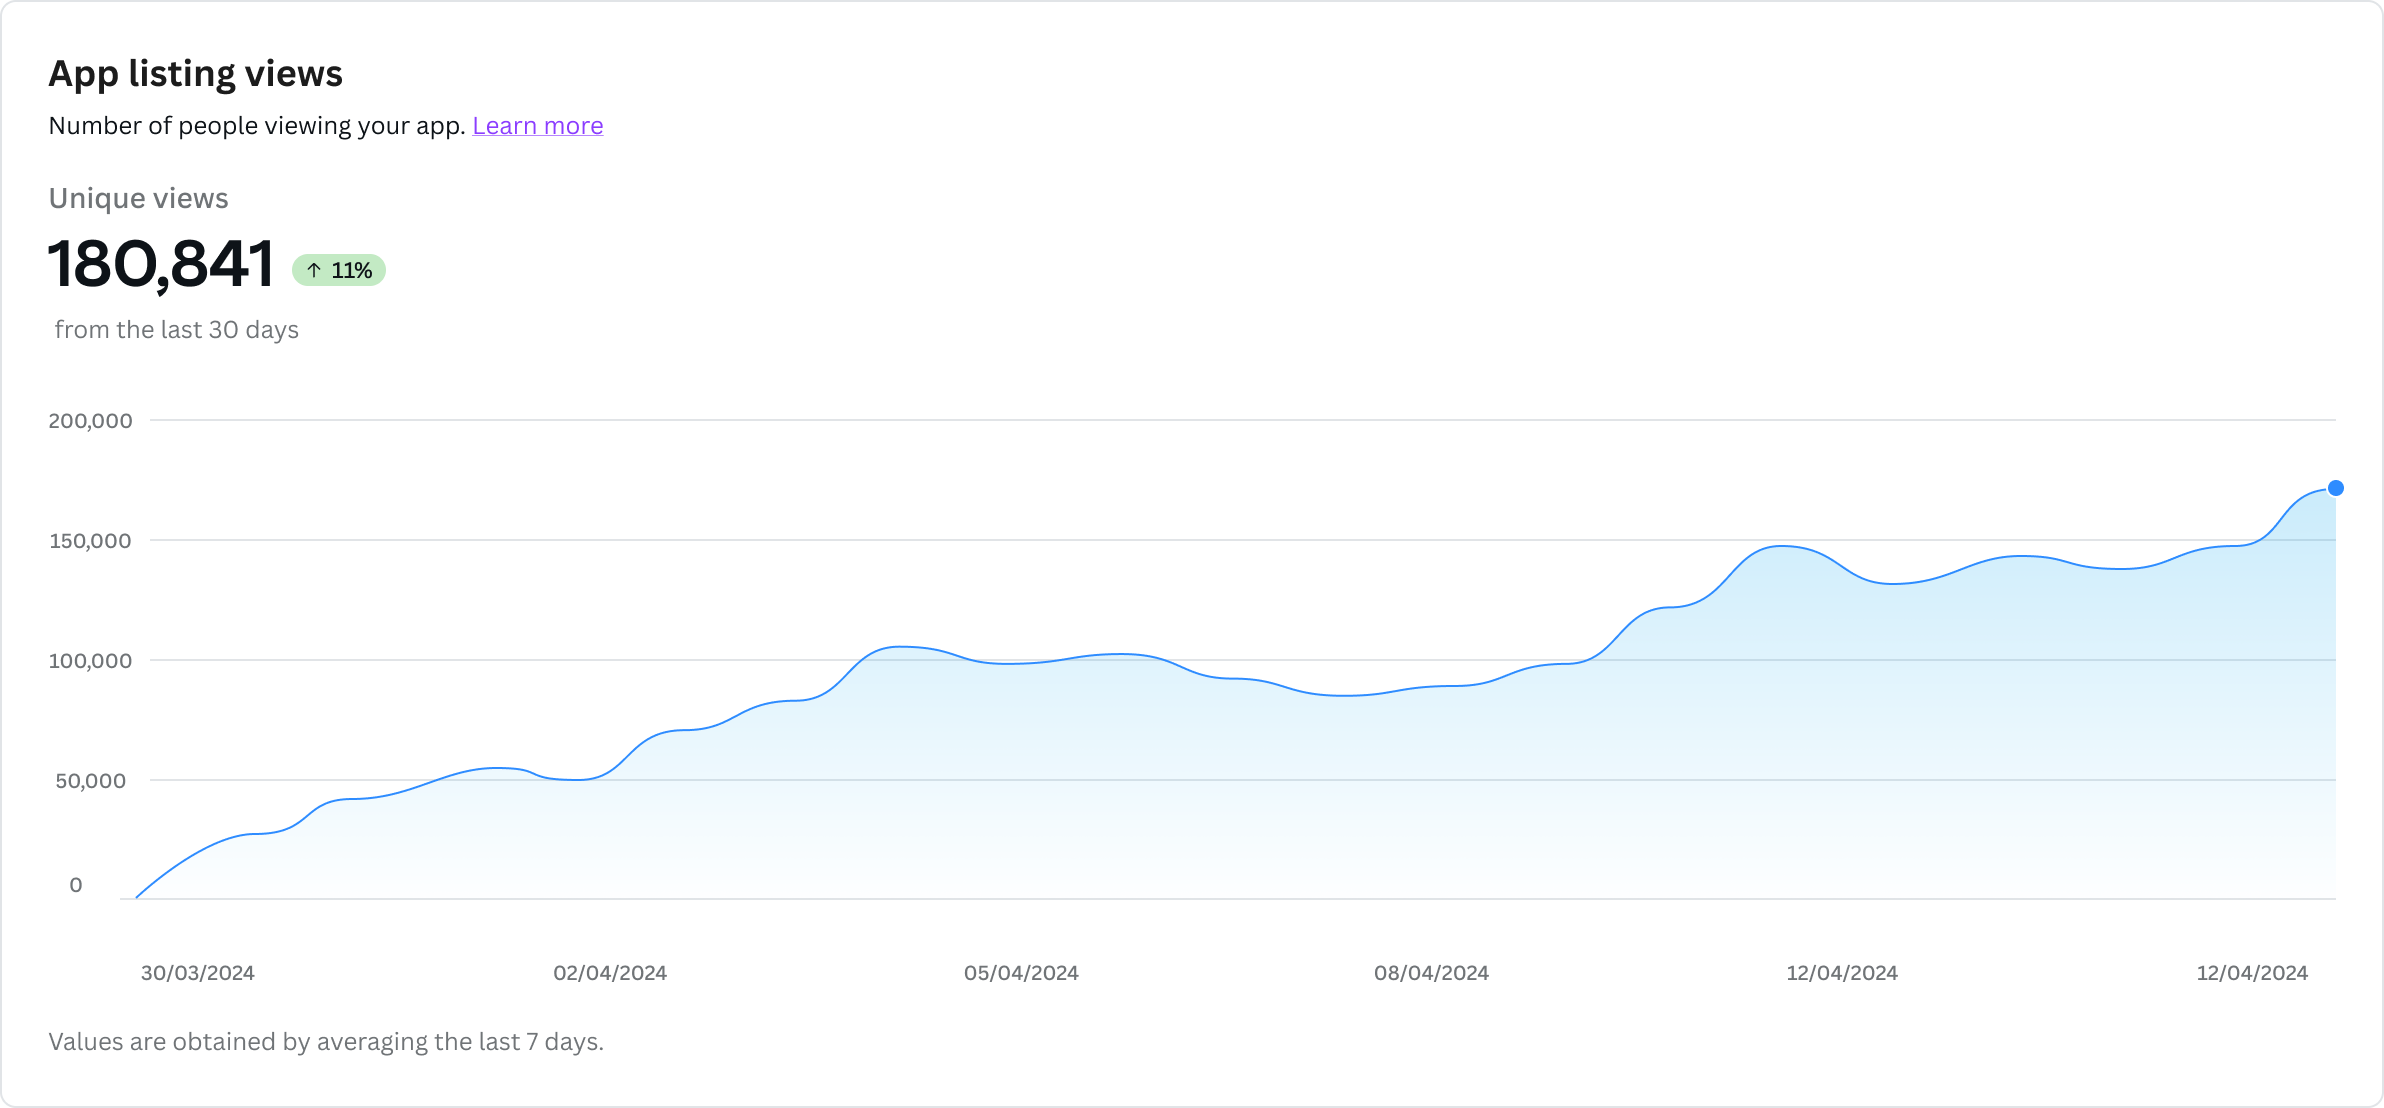
This is an example of the data available for the App listing views metric:

Here's a breakdown of what this data shows:
- The total number of app listing views by unique users over the last 30 days.
- The percentage change between the last two data points.
- The cumulative growth of the unique app listing views over the last 30 days.
Limitations
- Apps can't track analytics with third-party software, such as Google Analytics. This is because Canva's Content Security Policy prevents third-party scripts from being loaded within the app's iframe.