Backend
The science of routing print orders
How Canva uses graph traversal to handle the complexity of getting print orders to our customers.
In this blog post, we'll explore how Canva’s Print team has built a configurable rules system for graph traversal. We'll describe how this system ensures deterministic results and produces the best route for our users and the environment.
When you design with Canva, you have the option to print your designs on a range of products, from business cards and posters to wrapping paper, t-shirts, wine tumblers, and more. When you print with Canva, we need to determine where and how to bring your design to life.
The breadth of Canva’s growing product offerings means that it's impossible for one location in Canva’s printing network to create and print our entire range. The distributed nature of creating and printing products across the globe raises many challenges when it comes to deciding where to produce and ship orders to our users. The process of overcoming these challenges is collectively referred to as routing.
Where your order’s items are produced determines the delivery time, how many packages are shipped, and the emissions generated as a result of their delivery. At Canva, we want to do everything possible to ensure a delightful user experience. By optimizing where we print your order, we can cut down on delivery time and reduce our environmental impact. Knowing where to produce your order before you even place it empowers Canva to give the most accurate estimates we can, all before you click Pay.
In this post, we'll discuss the following topics:
- Pluggable component architecture
- Data architecture
- Decision engine
- Path traversal engine
- Logging and auditing
- Success measures.
Design a future-proof system
When we set out to build a routing solution, we knew it needed to provide more than value to our customers. It also needed to set our internal print supplier management (known as operations) and engineering teams up for future success. Aligning these three outcome pillars—customer, operations, and engineering—meant we needed a flexible, configurable, and extensible system.
Our solution needs to solve real routing problems for customers placing real orders. For example, we have a customer named Alice who wants to order a combination of T-shirts, business cards, and water bottles and needs them delivered to her office in Melbourne, Australia.
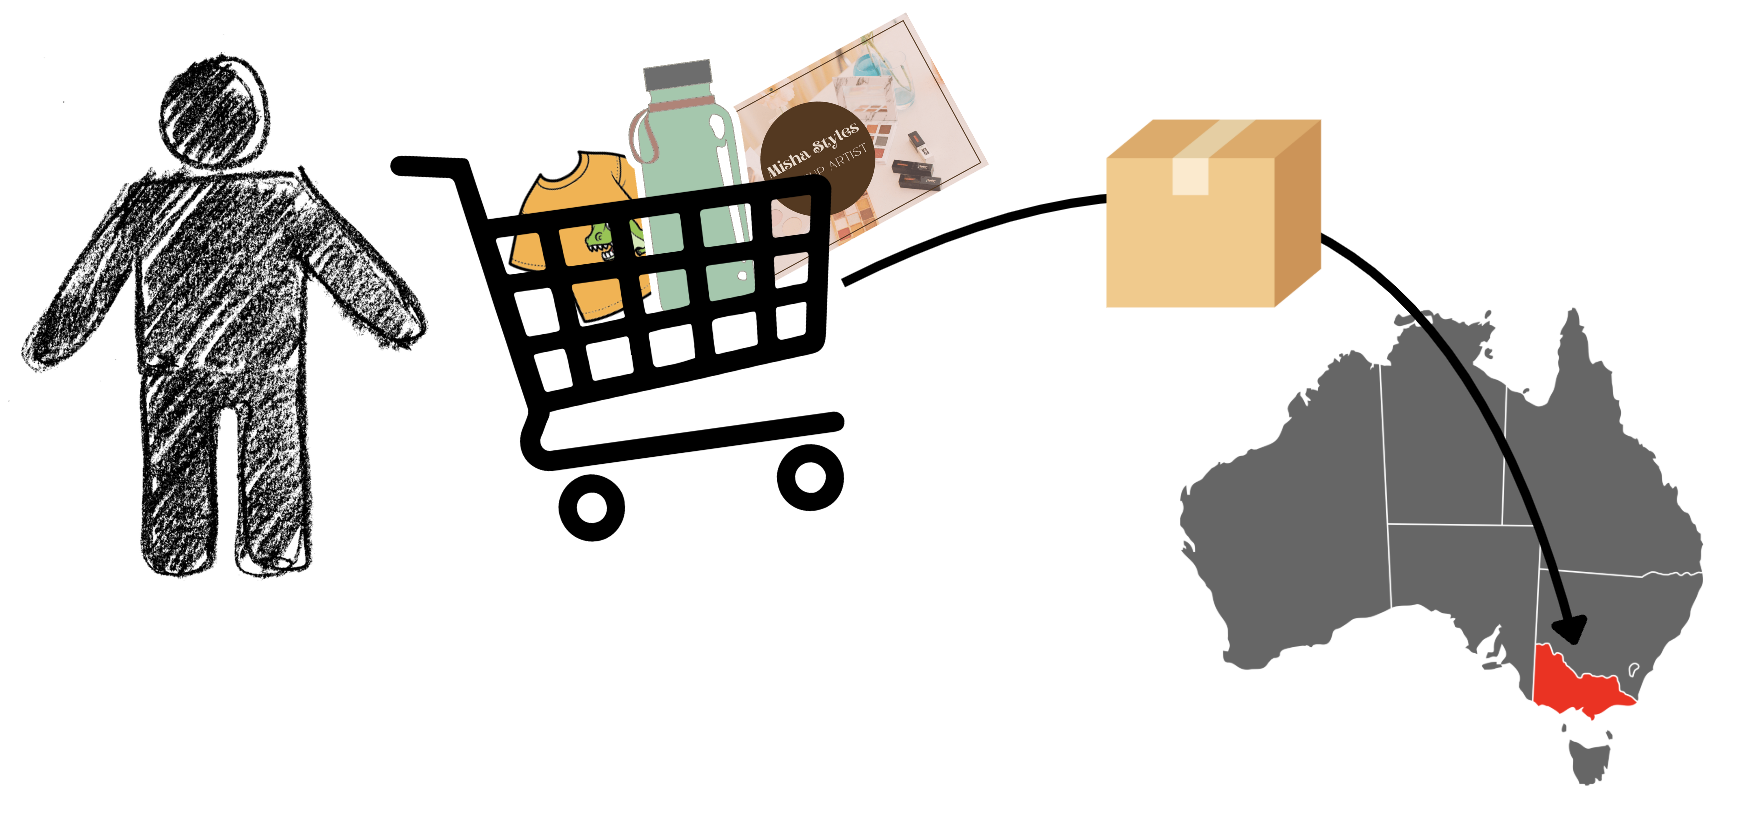
Our solution needs to combine this information with information about our network of suppliers and generate options that satisfy whatever requirements Canva has placed on a good order route.
We can see this as an evolution from what the user has requested (the products) to who can produce them (the supplier) and how to deliver them. Conceptually, this is a feedforward graph, but with so many other considerations, we need a flexible solution that can balance building the graph, traversing it, and making decisions about it.
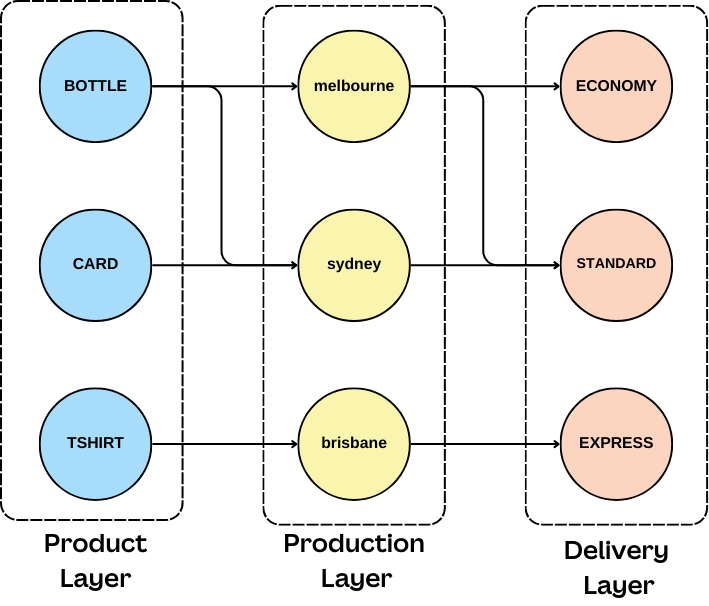
With these requirements in mind, we were determined to build a system that could withstand evolving requirements, priorities, or algorithmic direction and support future needs. To do that, we agreed on a system architecture that promotes plug-and-play componentry with siloed and well-defined component responsibilities.
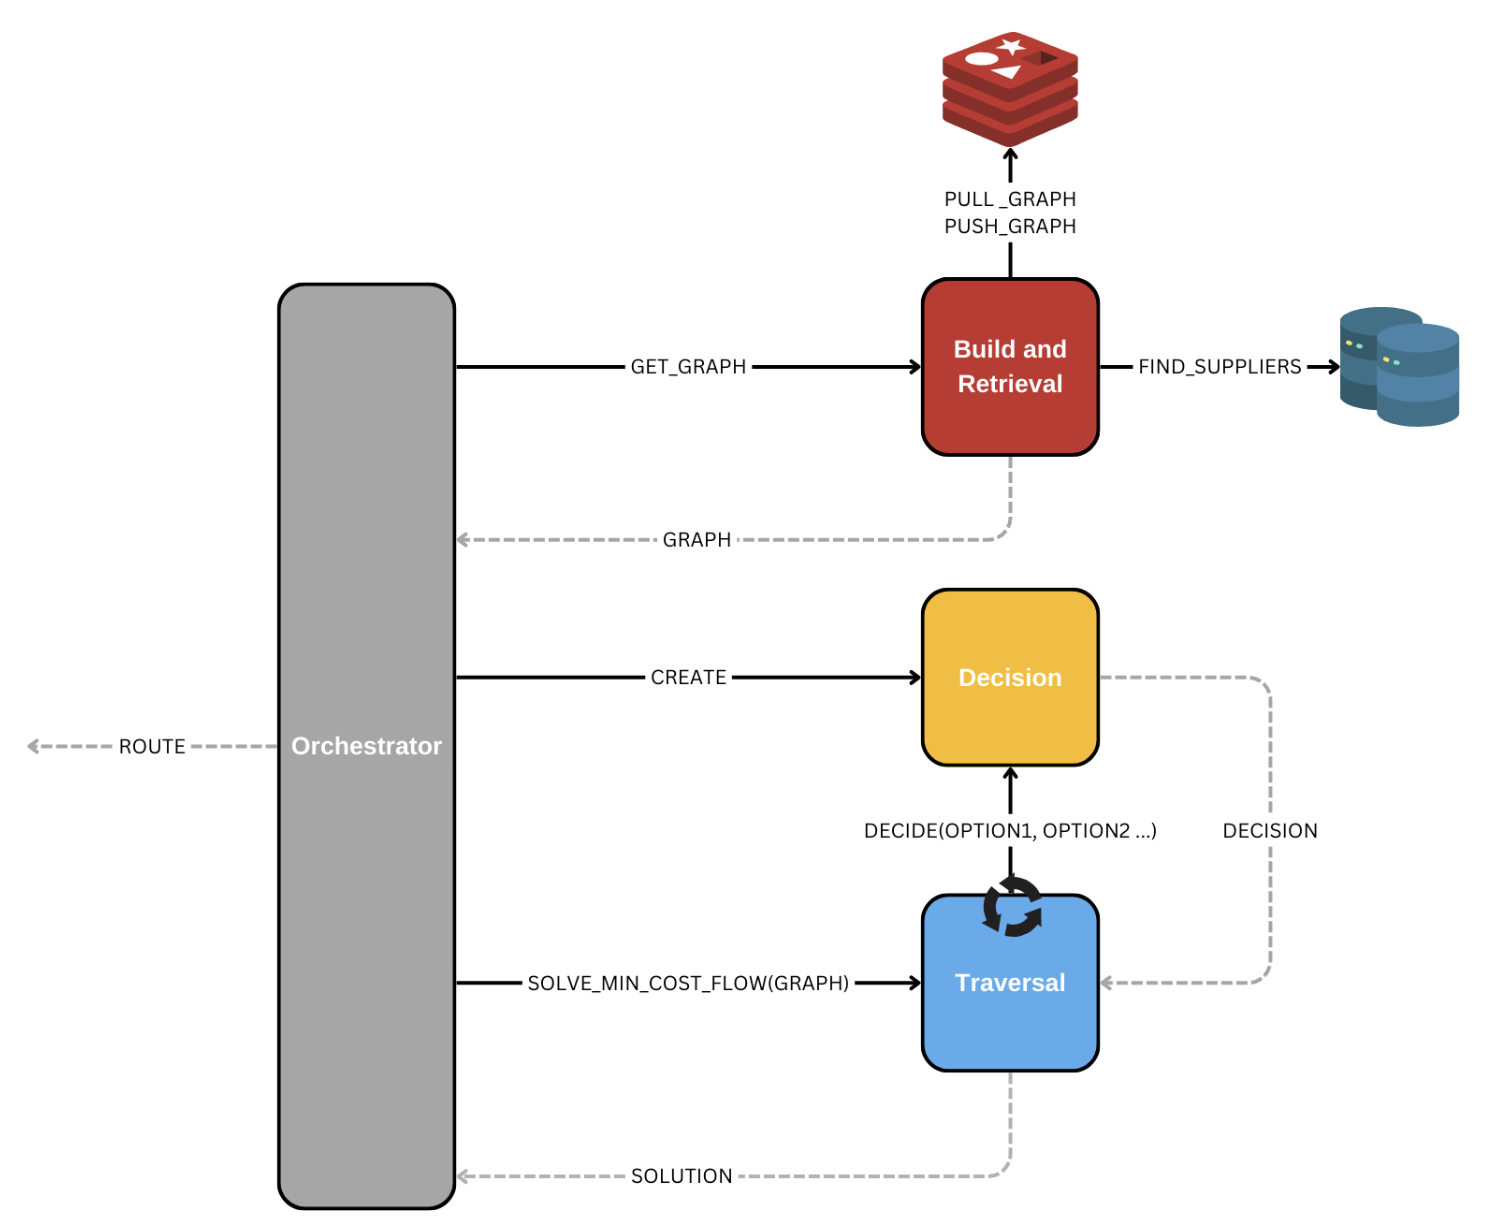
As per Figure 3, we have 3 major subsystems in our design:
- Build and Retrieve: Generate our graph structure (Figure 2) asynchronously and make it available on demand.
- Decision: Apply logic to rank candidate paths during traversal.
- Traversal: Use decision results and the graph to find a solution path.
Each system manages its responsibilities as independently as possible, with clearly defined contracts between them. This design takes inspiration from well-known, existing patterns we can observe in micro-services.

Although this system design pattern isn't new, it's important to highlight the benefits it unlocks for solution maintenance and longevity. To really clarify how powerful the sub-system design makes our solution, let's consider the following hypothetical situation.
Our routing system has been live for quite some time now and operates effectively. However, we’ve realized that managing decisions between potential paths is becoming unsuitable over time. The process is slow, doesn’t provide enough configurability, and negatively impacts the time it takes Canva to load and display options to our users during checkout. What do we do?
Traditional graph traversal solutions often couple graph traversal with how decisions are made between options. For example, we can look at how Dijkstra’s algorithm(opens in a new tab or window) is usually implemented.
During the execution of Dijkstra’s algorithm, we must collect cost information about paths to help us determine which path to traverse to give us the shortest traversal. Often, path cost collection and potential cost comparison to select the next edge are done together during traversal.
In the following code snippet, traversal, structure, and cost are completely coupled. If you want to change the way costs are determined, you must edit traversal logic and vice versa.
function Dijkstra(Graph, source):for each vertex v in Graph.Vertices:dist[v] ← INFINITYprev[v] ← UNDEFINEDadd v to Qdist[source] ← 0while Q is not empty:u ← vertex in Q with minimum dist[u]remove u from Qfor each neighbor v of u still in Q:alt ← dist[u] + Graph.Edges(u, v)if alt < dist[v]:dist[v] ← altprev[v] ← ureturn dist[], prev[]
Source: Dijkstra's algorithm(opens in a new tab or window)
A consequence of coupling cost with traversal is that when we need to change how we make decisions or how traversal occurs, any refactors or re-building impact both behaviors.
Coupling independent behavior into a single component or implementation leads to the possibility of regressions, which can result in breaking a functional piece of our system while making changes to something unrelated.
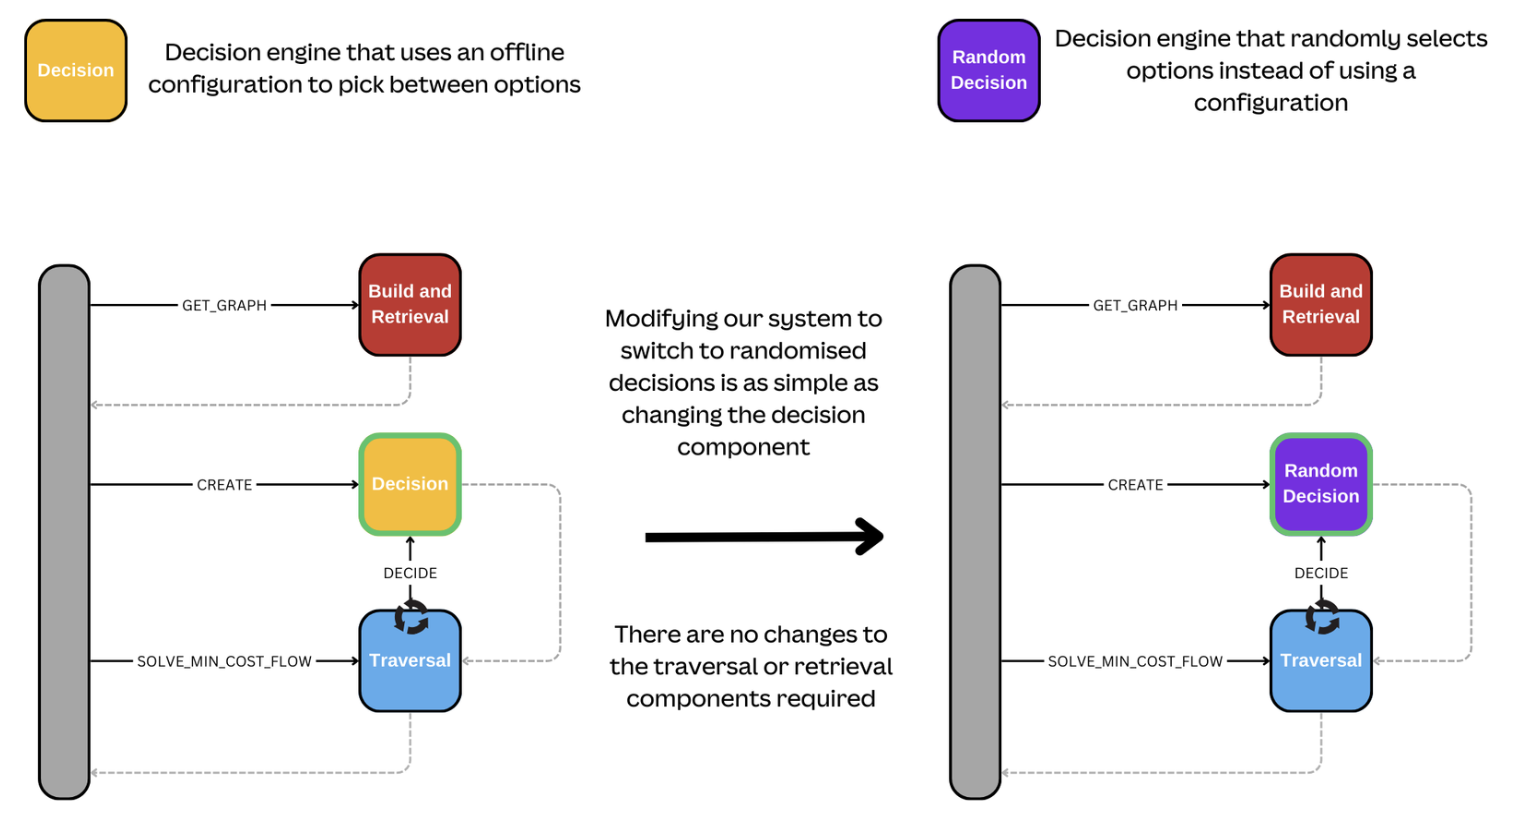
With our separated design, decision-making is its own component. As long as the contract it provides to the traversal component is unchanged, we can independently build a new decision component and gradually phase it in. There's no need to rebuild our traverser, change our graph, or any other part of the process. In Figure 5, see an example where we want to switch to randomized decisions. It's as simple as changing the type of decision component we use. We don't require any other system changes.
Even if, for example, we need additional data to support the new decision logic, this is still straightforward. We can build the graph building and retrieval component independently and roll it out in sync with the new decision maker without impacting the existing components and without the need for a complex refactor to support the rollout.
This not only makes things safer but also enables the ability to A/B test different versions of the components or experiment with optimizations without a full rewrite.
Model and retrieve a print network
At Canva, we predominantly use relational databases to manage our data. Relational models can handle complex data modeling effectively and are generally quick to query for complex lookups.
However, let's take a step back and consider how something as complex as a relational model describing an international network of production sites might be. At a minimum, there needs to be a way to model:
- The physical locations of the sites.
- The products and variations of those products they can support.
- Which parts of the world they can supply products to.
- How these different sites can ship, package, and manage orders.
Modeling in a relational store requires a non-trivial number of complex entities. It’s impractical for entities to be queried efficiently at runtime to generate a graph for traversal. Based on our use case, we expect our graph to be read often and rarely change. Why should we generate something that is, for the most part, static? Why isn’t it our primary data store?
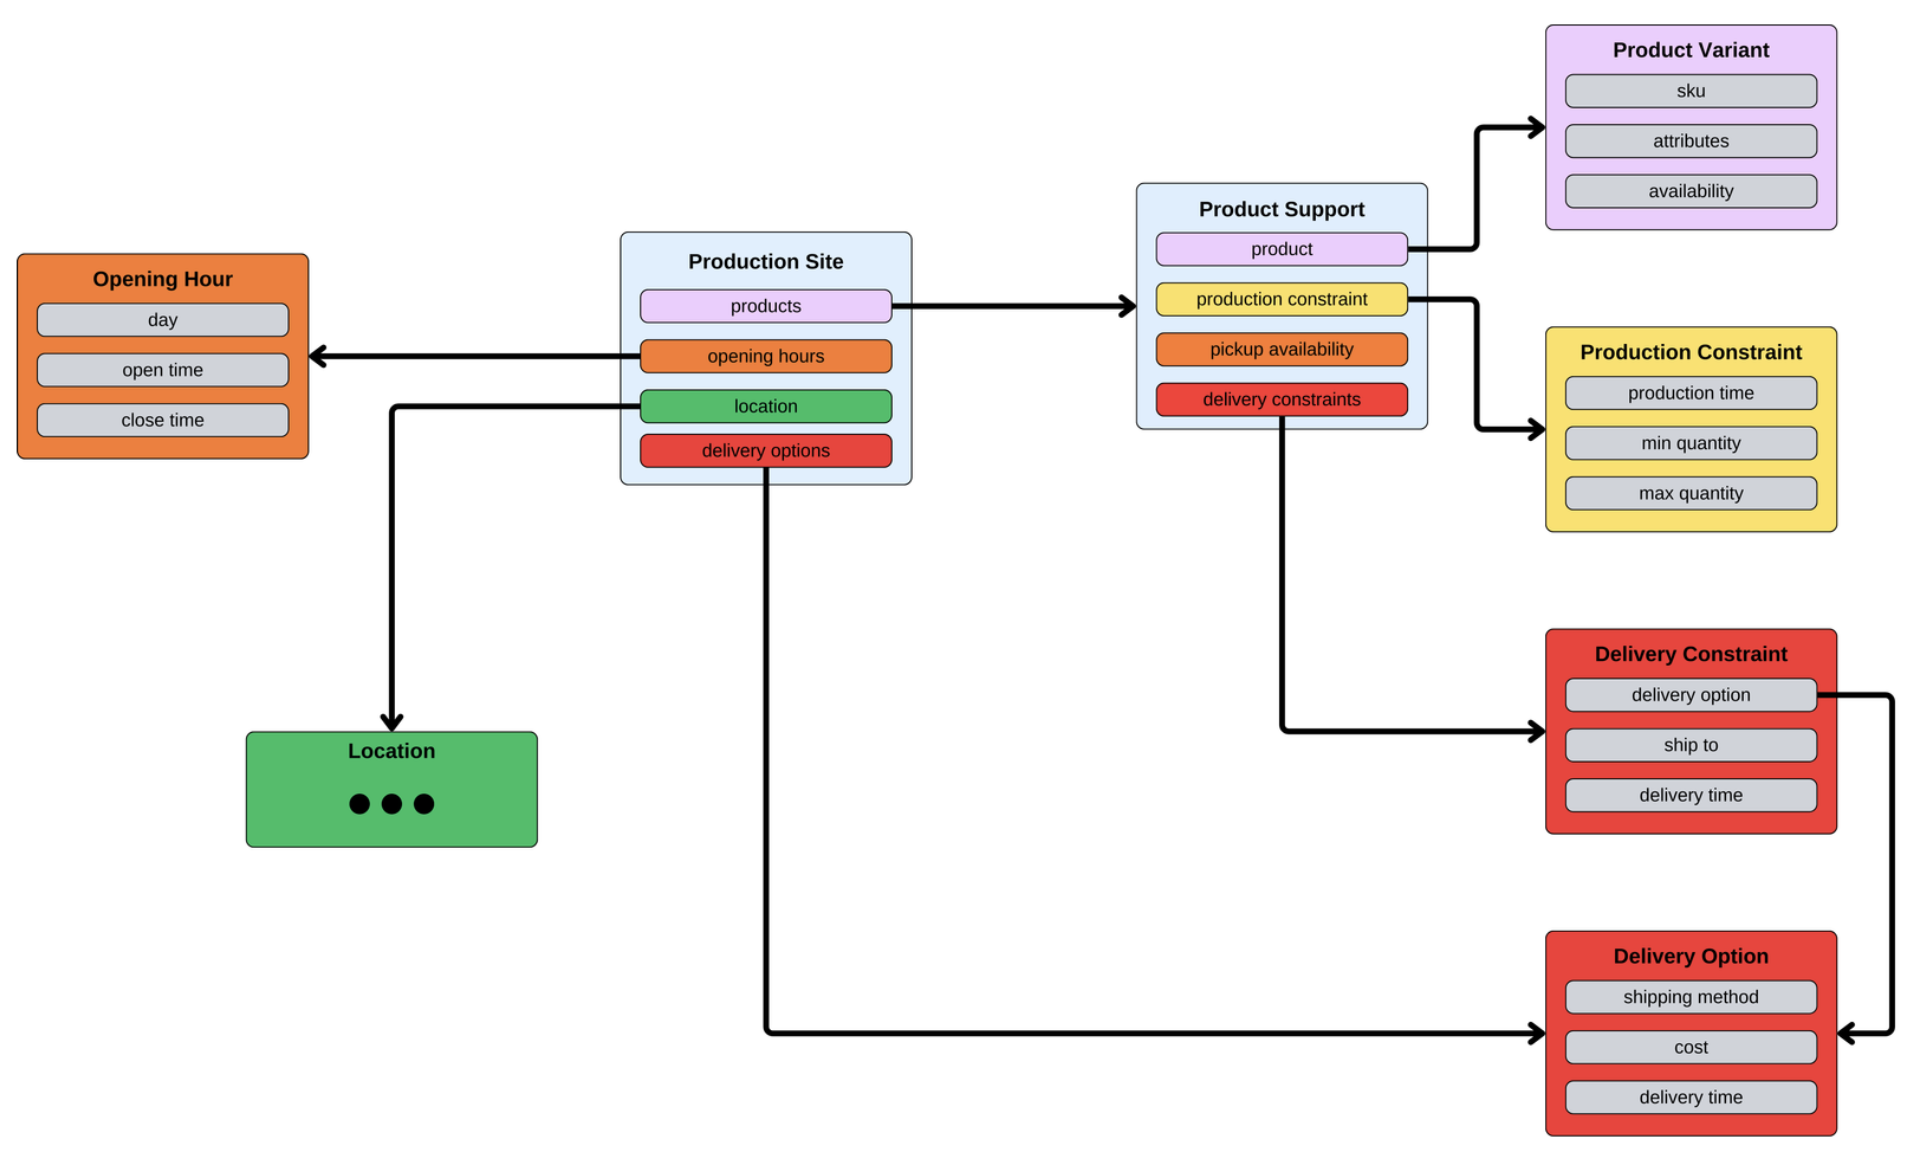
Relational modeling, like that in Figure 6, is extremely effective for managing small and incremental updates and for laser-focussed querying, the kind our operations team needs to manage the network. We would lose all these advantages if we moved to using a graph-based data store as our primary store.
Therefore, we're faced with a set of competing priorities. A lean network graph is the most efficient way for us to query and solve routing problems, but it doesn’t provide the benefits we need to support our internal teams in updating the data it contains.
We have a conflict between 2 of our 3 outcome pillars: the data model that’s best for our operations team is not what’s best for our customer outcome. The model that suits efficient updating (operations) is not the same as the one that suits efficient reading (routing customer orders).
So, our answer to this is to do both.
Solving for everything gives rise to the following 3 challenges:
- How do we guarantee, as much as possible, that these 2 views of the data are aligned?
- How do we make the graph data highly available to all consumers?
- How do we manage a potentially large graph for efficient traversal?
To address these concerns, we use an asynchronous process to build the graph. The graph is reactively rebuilt and published when updates of interest occur in our relational model, ensuring we have a single source of truth in the relational model. A single source of truth is important because it empowers us to rebuild the graph if there is an issue and for disaster recovery if our graph data is lost.
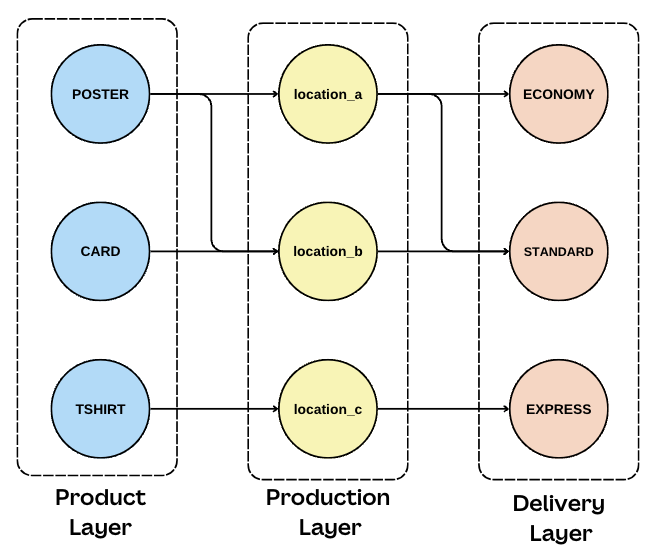
The generated graph structure is surprisingly simple. We model the graph using a layered approach, from products to production sites to delivery options. This approach is easy to visualize, allows the flow in our graph to always be directed forward, and is optimized for minimum-cost flow traversals.
Our technology of choice is a combination of ElastiCache and Redis. The asynchronous processor pushes updates to the cache that are made available immediately to all agents answering routing queries.
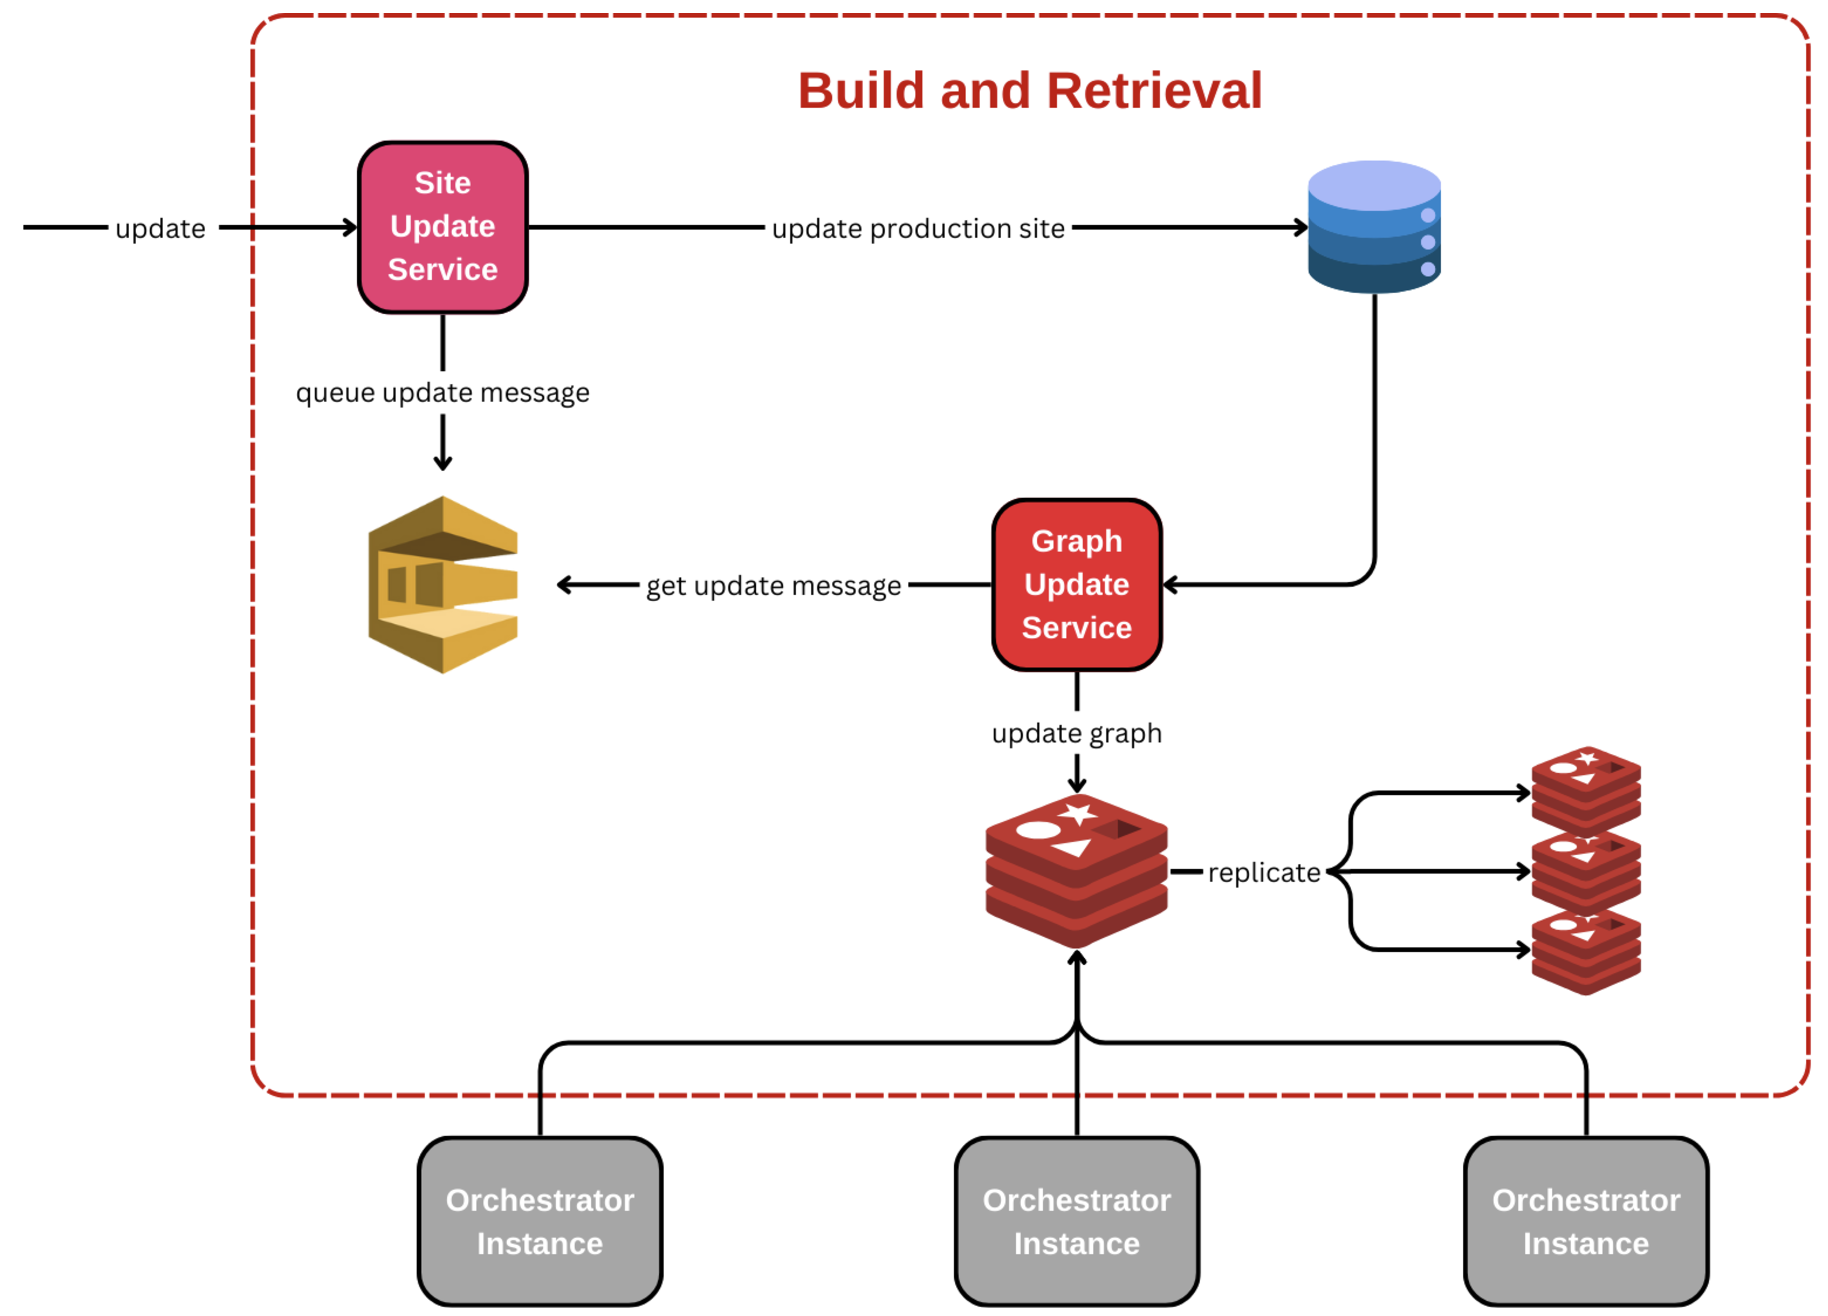
A potential issue with this approach to achieve distributed consistency is the size of our graphs. The larger the graph, the longer the retrieval, even from a system as readily available as Redis. A graph describing our entire international print network is necessarily large.
We quickly aligned on data sharding as a solution to our problem. We use an order’s destination to produce a shard key, building multiple graphs containing a view of the network supporting routing in a specific region. With a sharding strategy and the decision to pre-build the graph, we can achieve retrievals in 6 milliseconds in most regions, with some larger shards requiring up to 20 milliseconds. The smaller graphs also mean less to traverse, making our eventual traversal faster and more laser-focused, with fewer back steps or dead ends.
Which option is better?
When we filter our network to only locations that can produce your order, we must select the best route from the many potential paths. We do this by traversing the filtered network and calling the Decision engine.
The Decision engine only has 2 responsibilities:
- To decide the better of two candidate paths.
- To order a list of candidate paths from best to worst.
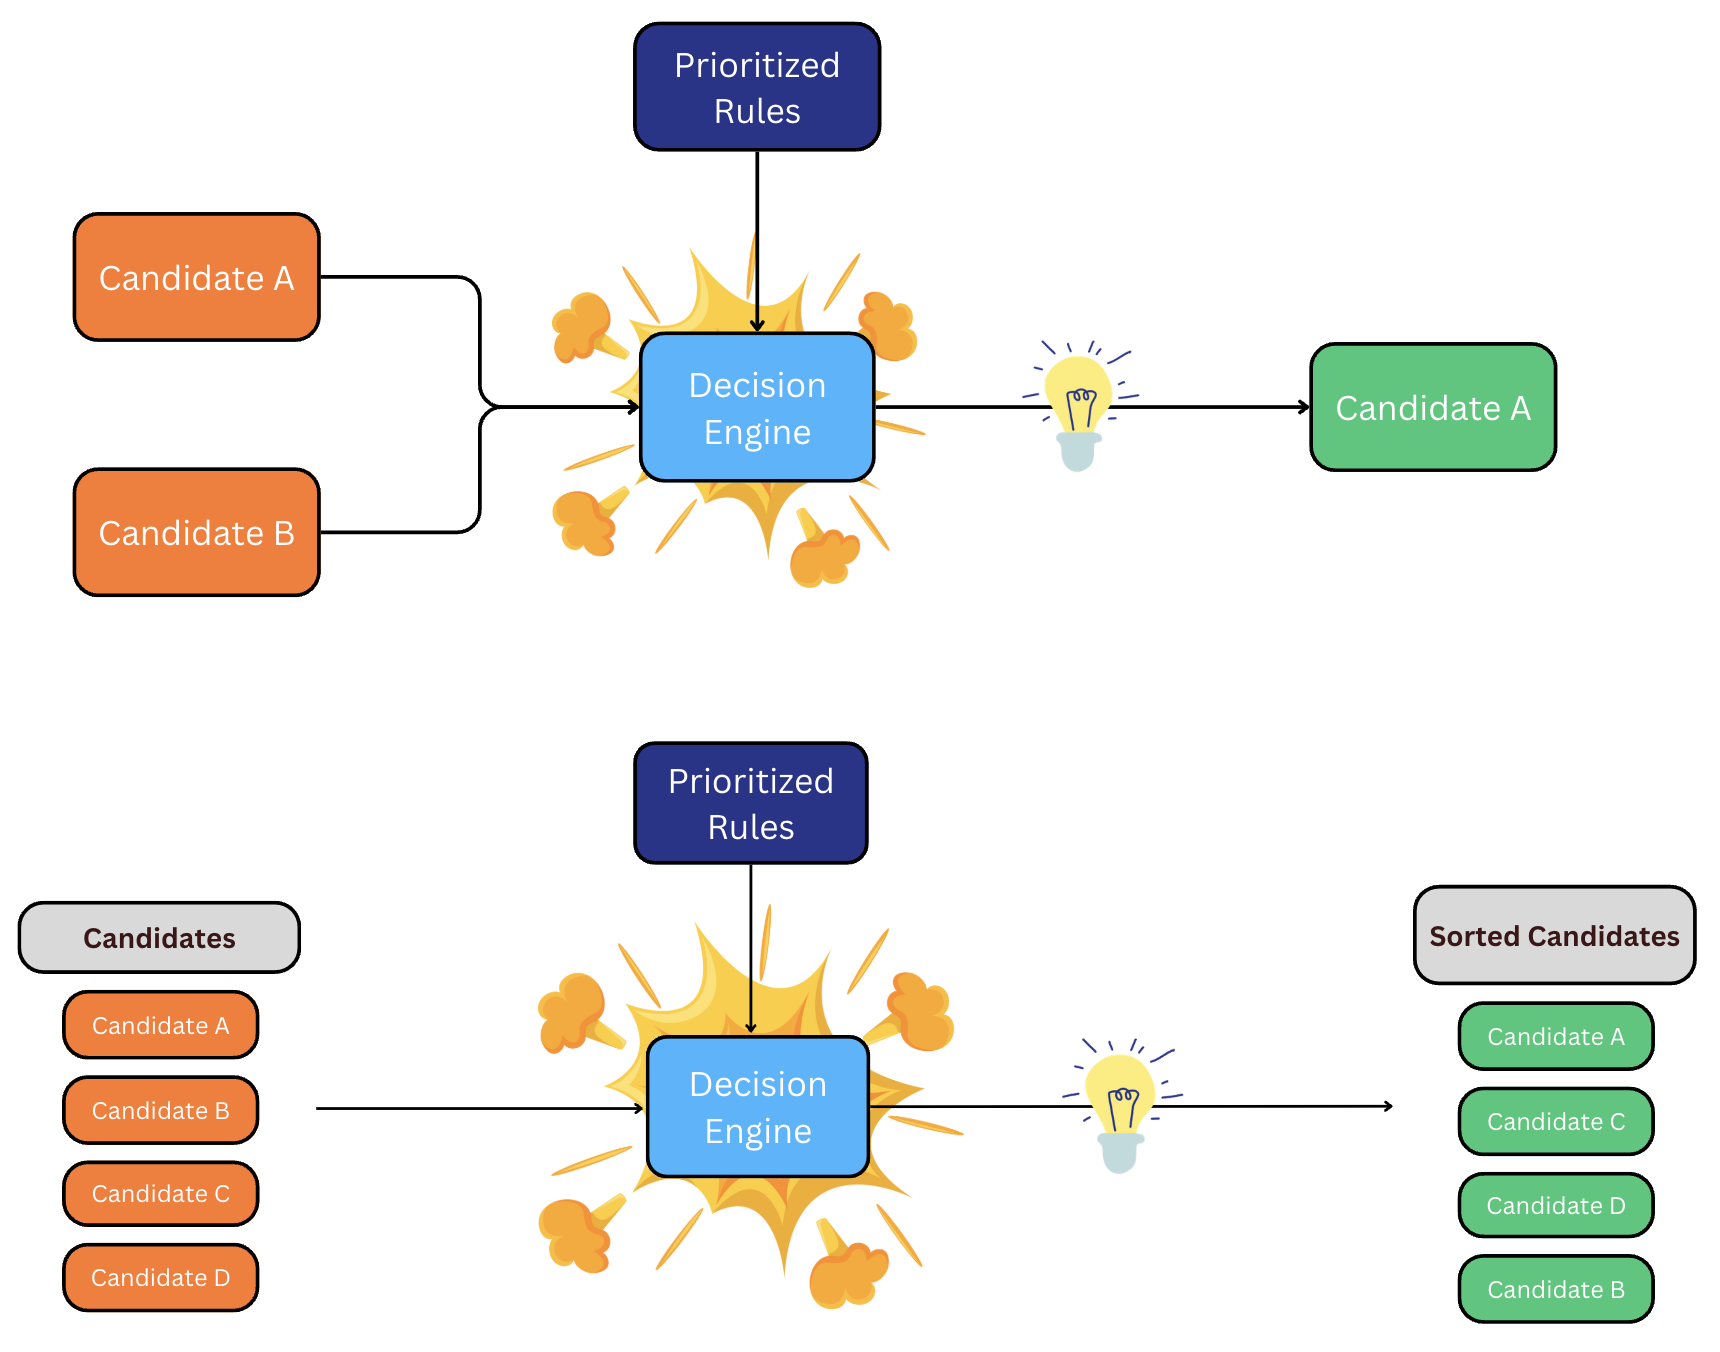
This raises the question, what makes one path better than another?
To help us determine a qualitative result, we have a list of desirable conditions known as rules. Each rule is evaluated in order and answers a simple question: based on this rule and only this rule, which path is better? If our question isn't answered, we move on to the next rule, and so forth.
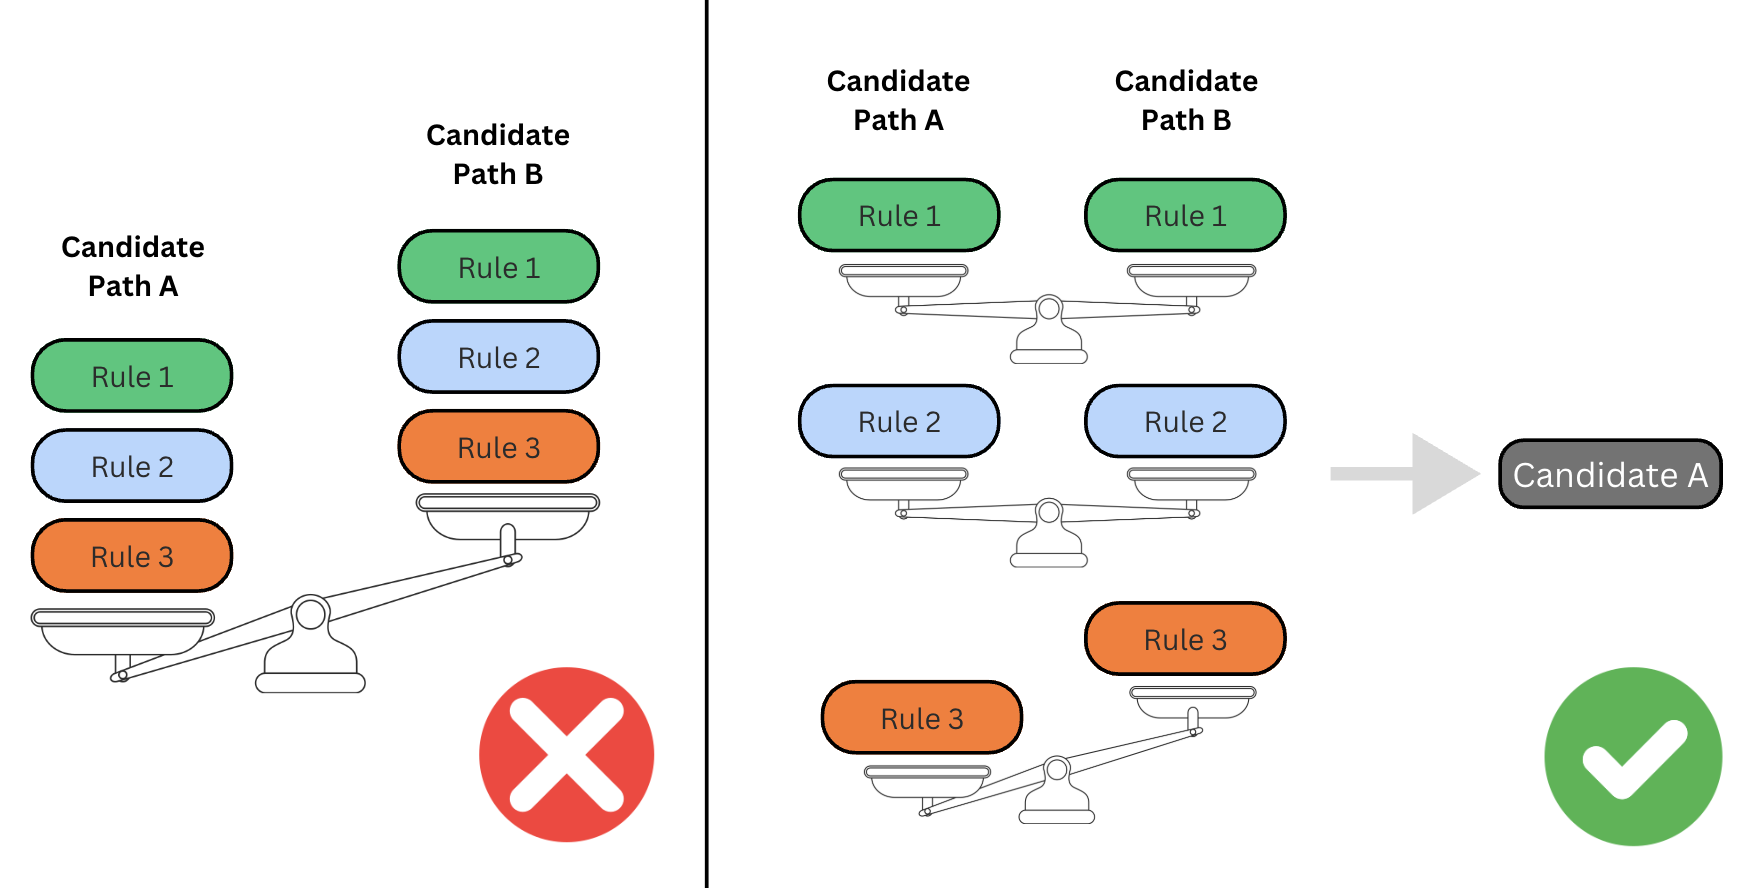
For example, we have a rule that preferences paths containing locations with production capacity. This is driven by operational constraints of smaller locations in our network that might struggle with producing a high volume of items. To avoid longer production times and ensure you get your items without delay, a path where your order is split between two different locations might be the better option.
But what if both paths route to locations with capacity? Do we randomly select a path? No.
To ensure determinism in our decision engine, meaning that we always get the same result given the same input, a condition must set two paths apart if they're equal for all other rules. This removes any randomness and provides transparency in our decision-making process. The base condition we use is to prefer the route with the lowest total production location distance to you, the customer, because it's nearly impossible for 2 locations to be the same distance away down to the centimeter. It also directly ties into Canva’s goal of reducing the distance your items travel, meaning lower carbon emissions associated with transportation and shorter shipping times, leading to you getting your designs faster.
One of our outcome pillars when building the decision engine was to empower our operations team to easily manage routing logic for each region. This would be through the adding, removing, and reordering of rules. When our operations team considers adding a rule, we assess the specific needs of the condition. This helps us determine whether to implement it as a filter or rule. Filters are applied during graph preprocessing to eliminate production locations that don't meet the specified criteria. It would be before we call the decision engine. Conversely, we designed the rules used in the decision engine to be more lenient in their approach, aiming to be more generous with equality among paths until differentiation becomes essential. Often, distance ends up being the deciding factor in our decision engine.
Routing is complex. One rule can make a huge impact on the route as a whole. We designed the decision engine and its rules to be simple, ensuring they remain clear and easy to manage.
Traversing our network
Graph traversals tend to explode in search depth, time, and complexity, which wouldn't help us achieve our desired customer and engineering outcomes.
Although a full discussion of the time complexity of our algorithm is a little out of scope for this blog post, there are some practical steps we took to reduce the search space and expected time of our traversal:
- Using a successive shortest path(opens in a new tab or window) inspired minimum cost flow solver. This algorithm is
O(VE)in time complexity, whereVis the number of nodes andEis the number of edges. - Intelligent selection of our initial nodes (see Optimizing to avoid regrets). This reduces the maximum size of
VandEby reducing the visible graph cross-section during traversal. - Assigning zero flow to undesirable edges, hiding them, and reducing the maximum size of
E. - With
VandEminimized, we can constrain the maximum execution time of our solution on any size graph.
We touch on all of these points in a bit more detail throughout this section.
We now have a graph representing our print network and a method for comparing routes and deciding which is better. All that's left is to traverse the network efficiently and build the best route for our customers.
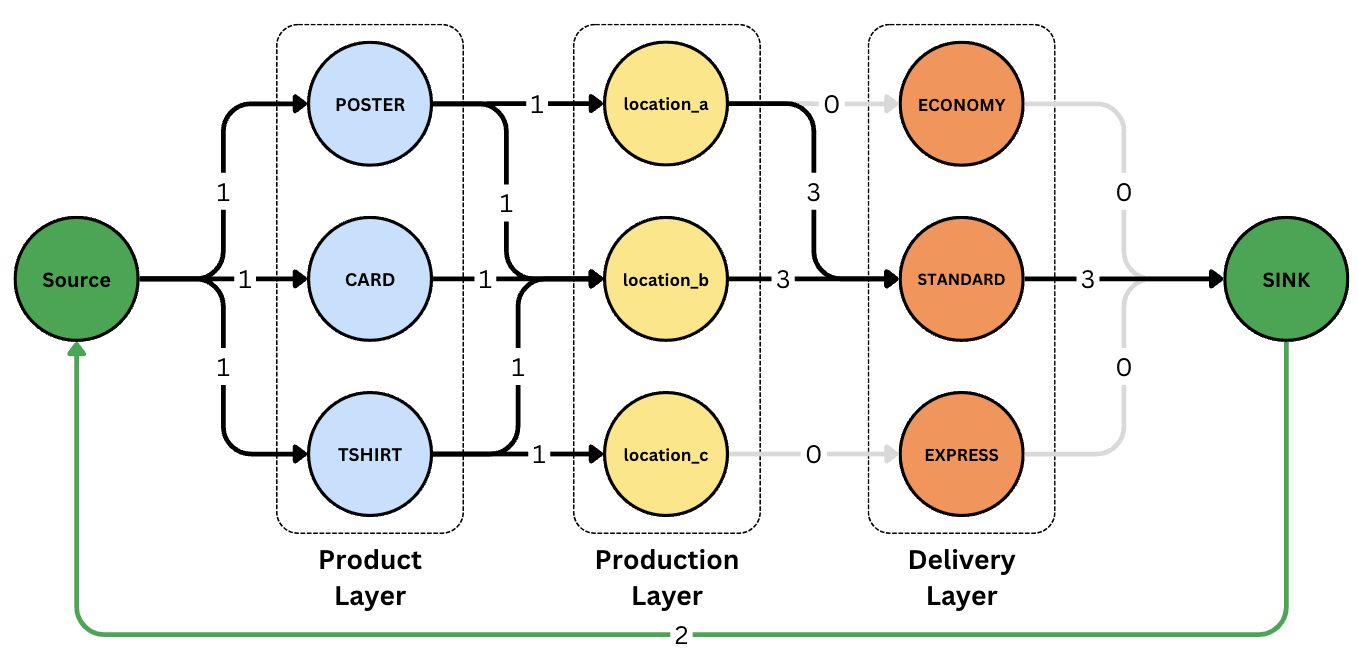
Before we can start traversing, we first need to do some pre-processing of our network. Based on what the customer is getting printed, we map flow limits to the edges that connect nodes in our graph. We can effectively remove unwanted edges by assigning them a limit of zero. This essentially filters them out of the graph. For edges we want to traverse once, we assign a flow limit of 1. For edges we don't want to limit, we assign a high number that we'll never hit.
Finally, we have the source and the sink node, which are basically the start and end points. These balance the graph by forcing all flow to start and end at single points. As our traversal is a basic forward-marching machine, we create an edge that links the sink to the source and gives it a flow limit of 1 less than the desired max flow. This means that the traversal can know it's done when it can't go forward anymore and at the sink.
When all is said and done, we end up with something like the following.
With pre-processing done, we can step through the network. For those who know the terminology, we use a modified min-cost-flow algorithm that uses path comparisons instead of numerical costs. However, one of our goals in making this routing network was to make it explainable and understandable without knowing the terminology. For this reason, we like to humanize the traversal process.
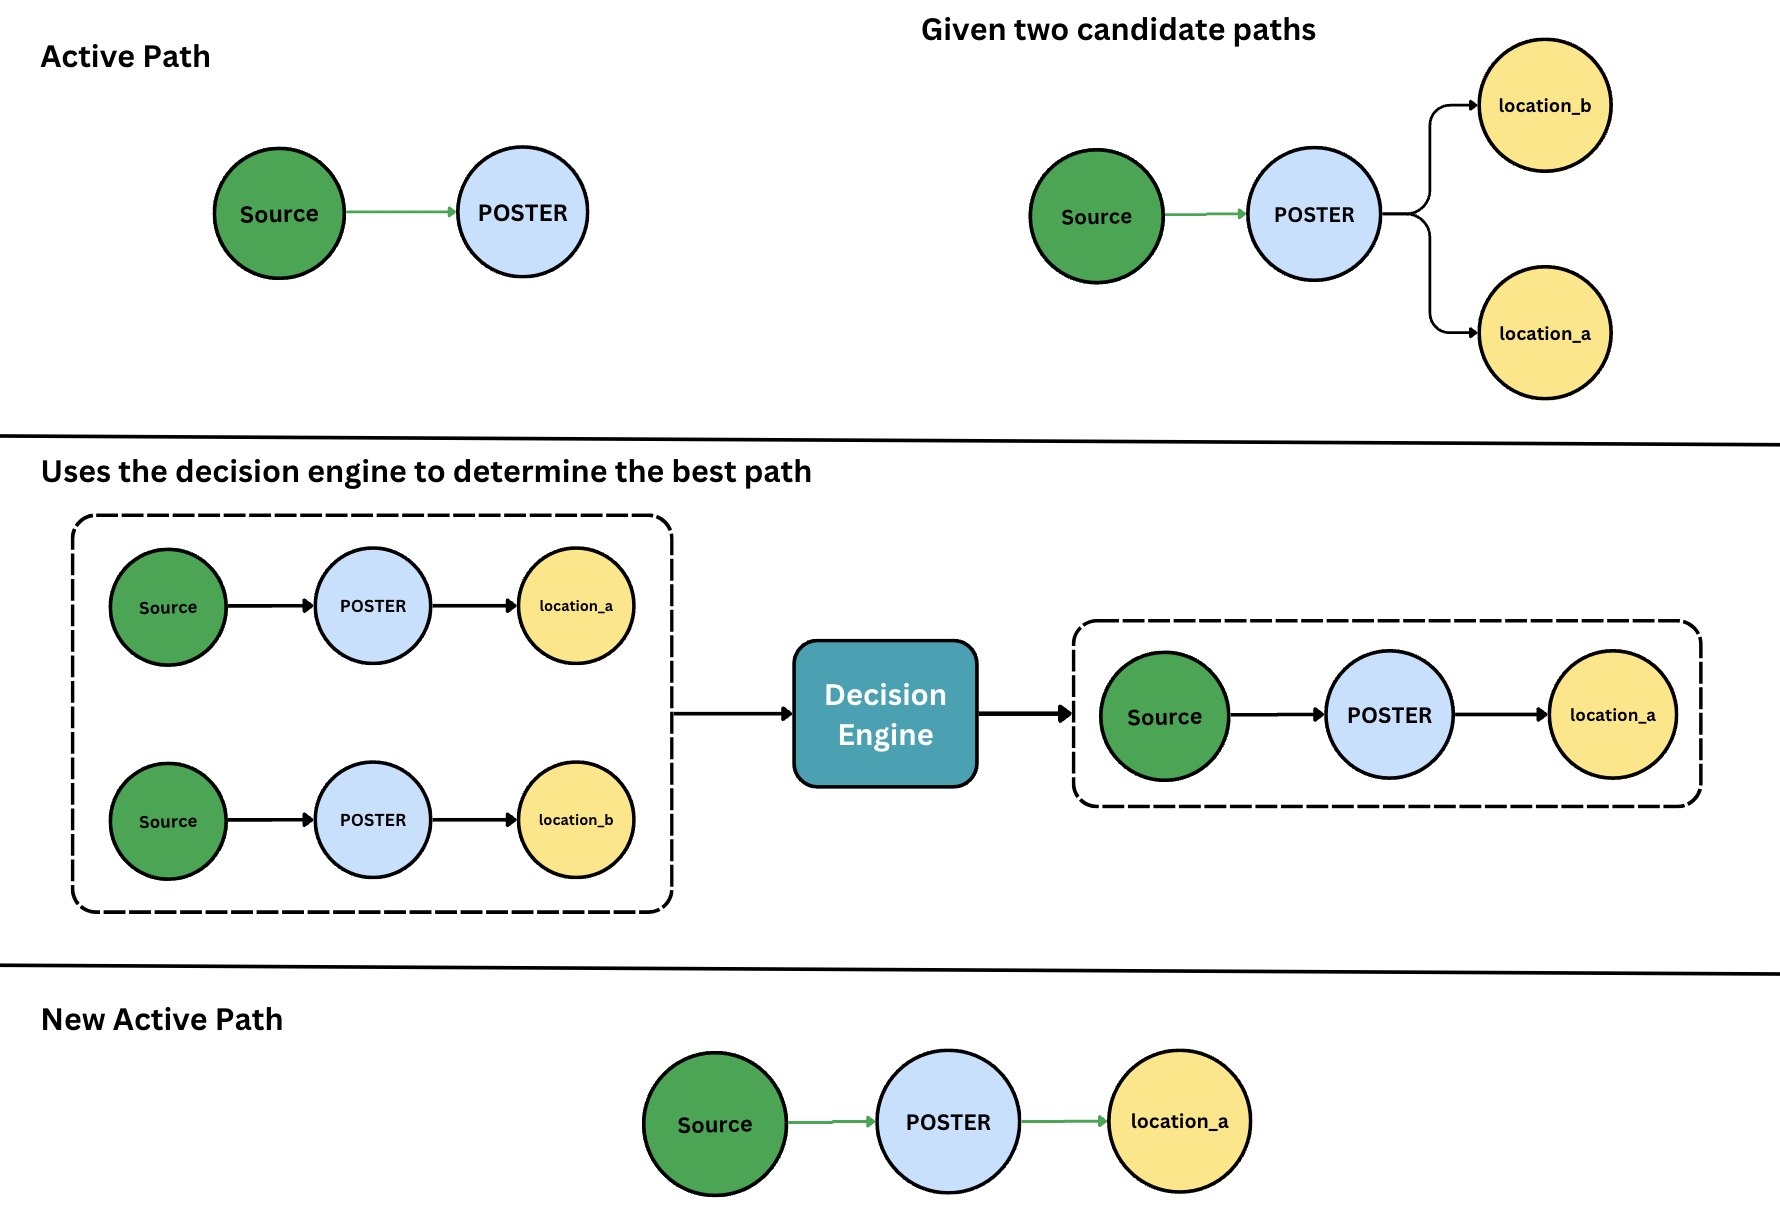
As we move through the network, we build many paths. These paths are one-dimensional lists of nodes we've visited. When we start, the path has one node, the source.
At each step, the traverser has an active path it's investigating, and that active path might have many options for moving forward. We build a list of prospective paths from these options and feed those into the decision engine. The decision engine ranks the options, and the traverser will always choose the top-ranked option to follow, becoming the new active path.
But what if we make a wrong decision? We might choose to route a set of business cards to be printed in Sydney because it's closest to the customer, but later find that the Sydney printer can't print stickers, and there's a printer in Melbourne who can do both. If only we'd known, we could have sent everything to the Melbourne printer.
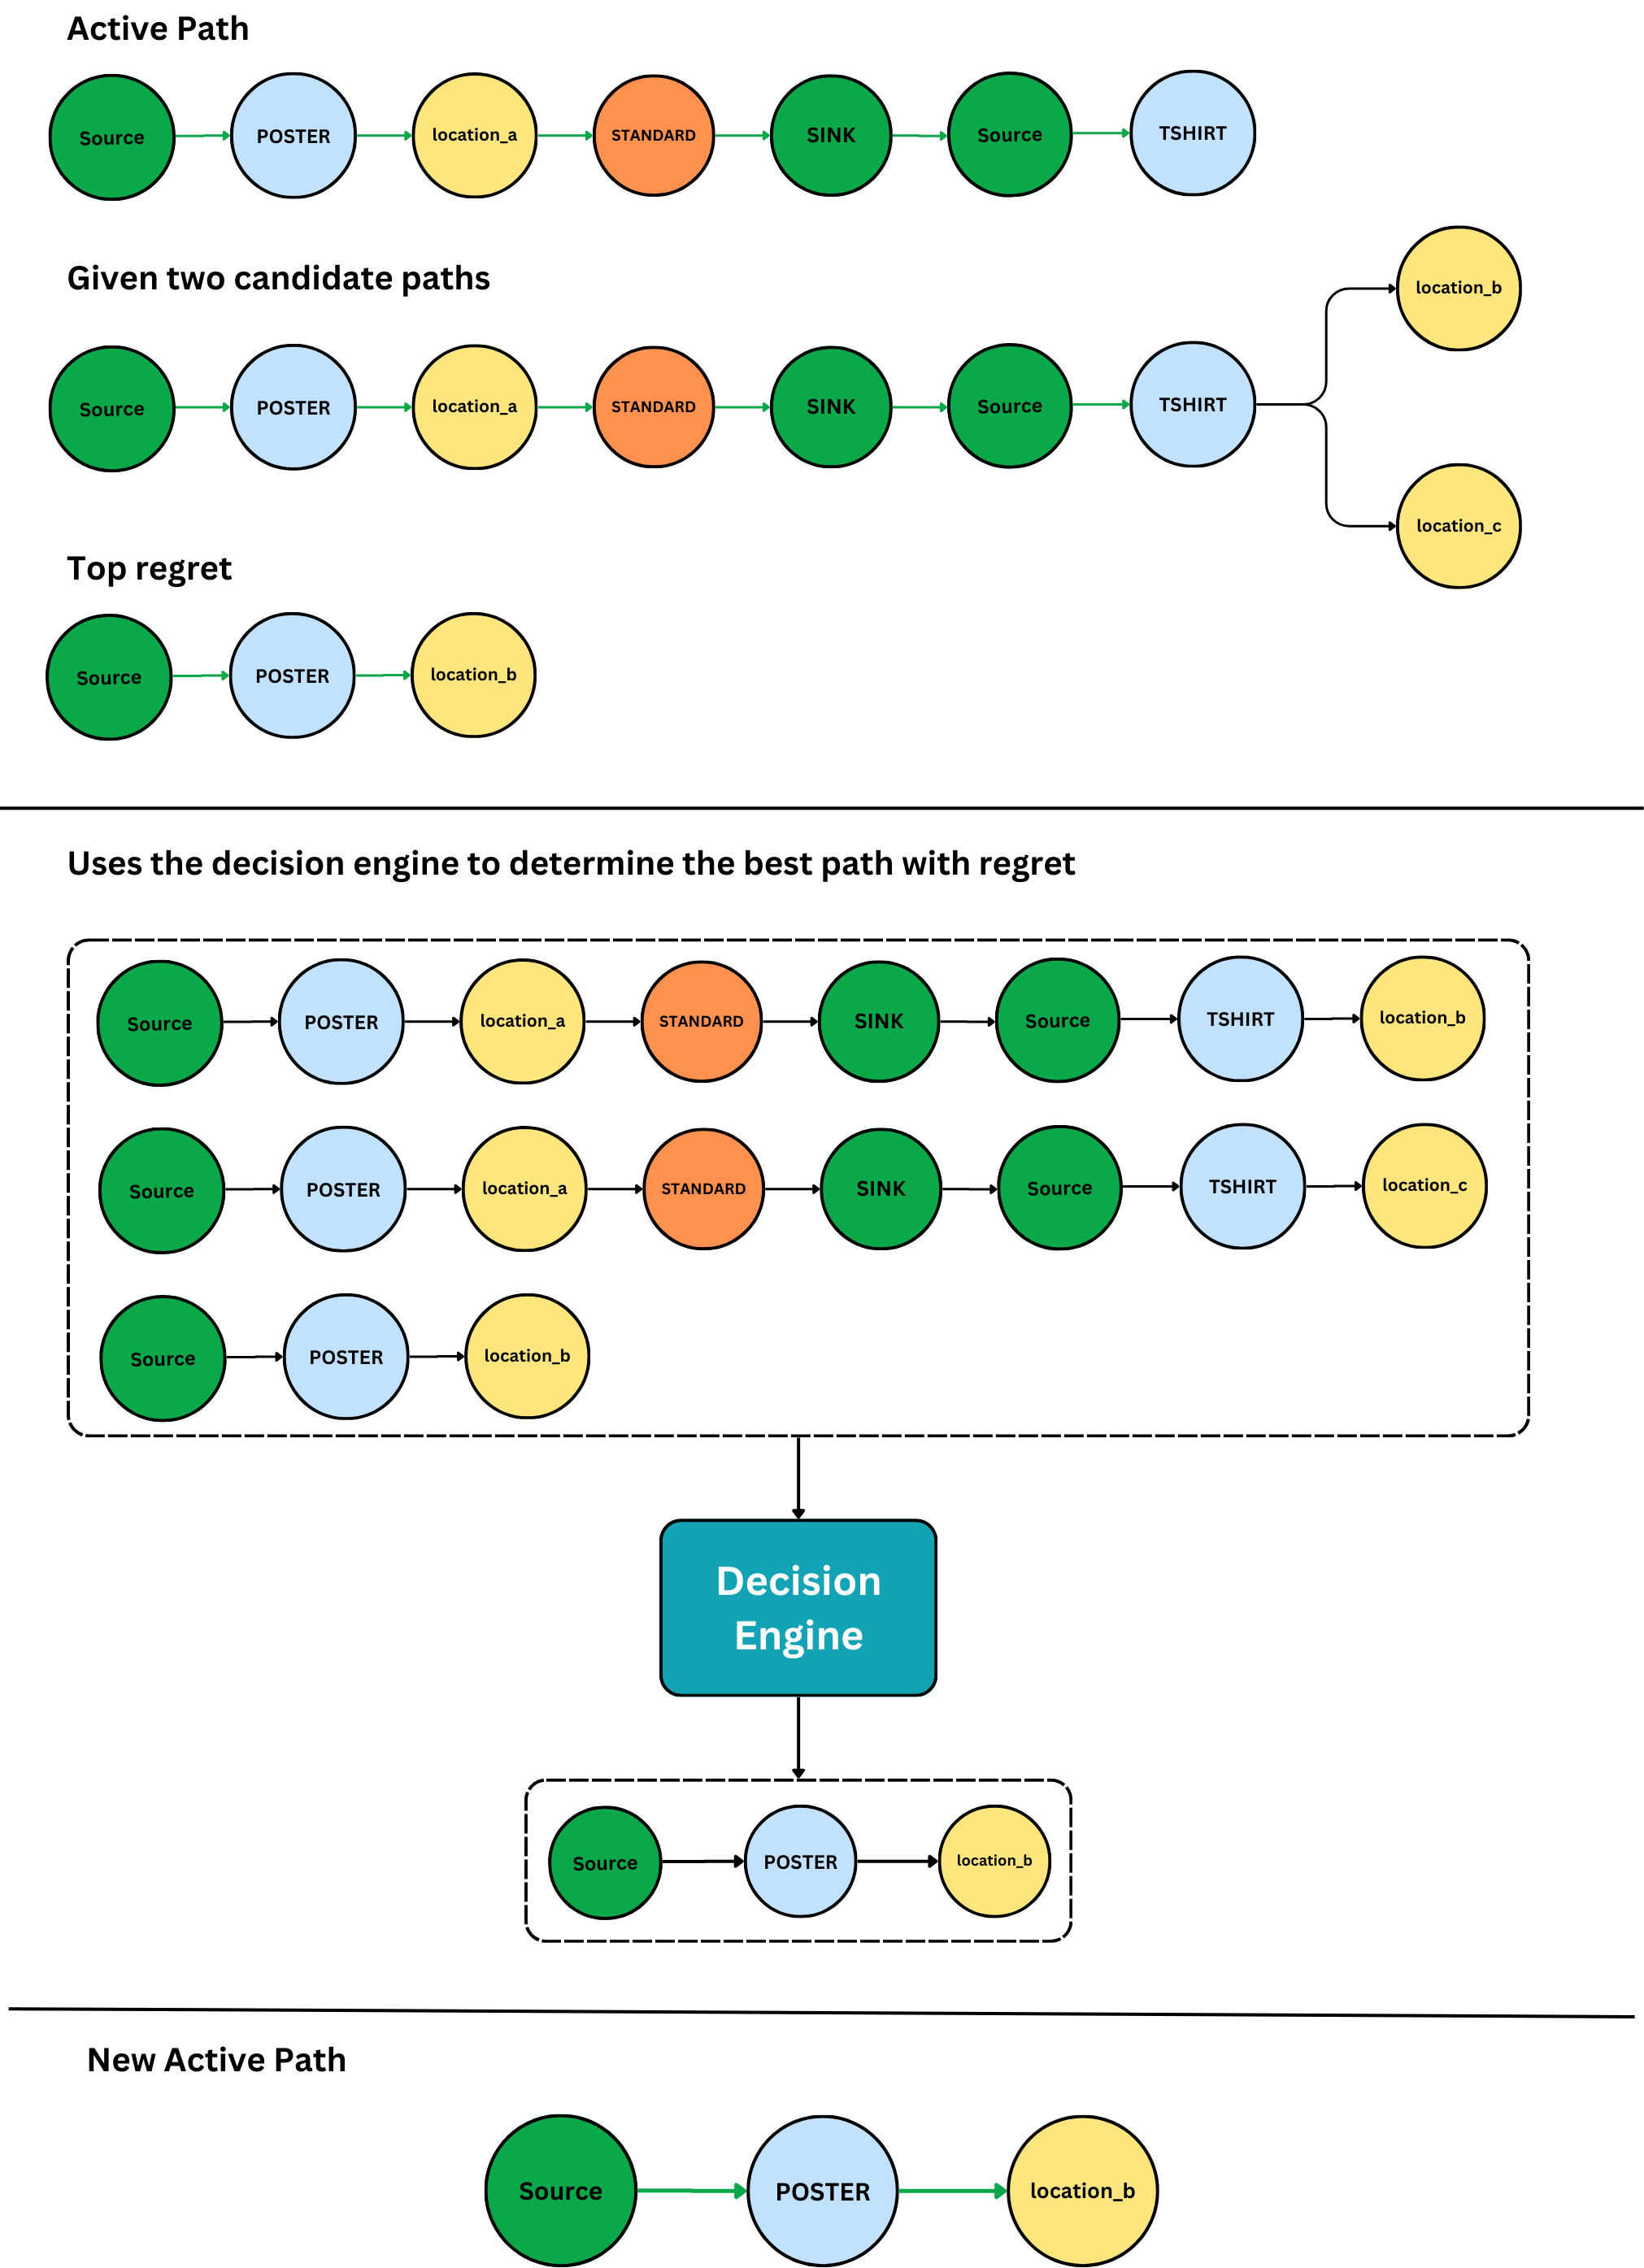
Our traversal algorithm handles this case through a process called regrets. We include the unchanged active path in the rankings performed by the decision engine. If the decision engine tells us that we'd be better off not going forward, we know the path we're taking has degraded. But our traversal must go forward, and it now knows it's making a choice it might regret later.
When the active path degrades, we save the best alternative path as a regret. This regret haunts our traversal's every decision. That is, we include the top-ranked regret as a possible path forward at every step. If the regret wins the rankings of paths forward, we kick off a process of regret-revisiting:
-
We save the best alternative, that is, the best path forward if the regret wasn't there, as a new regret itself.
-
We reexamine the sibling decisions of the regret that won, and save its best sibling as a regret.
Going back to our previous example, we might later route a t-shirt and find that there's a printer in Brisbane that can print the t-shirt, sticker, and business cards.
-
We start using the regret that won as the new active path.
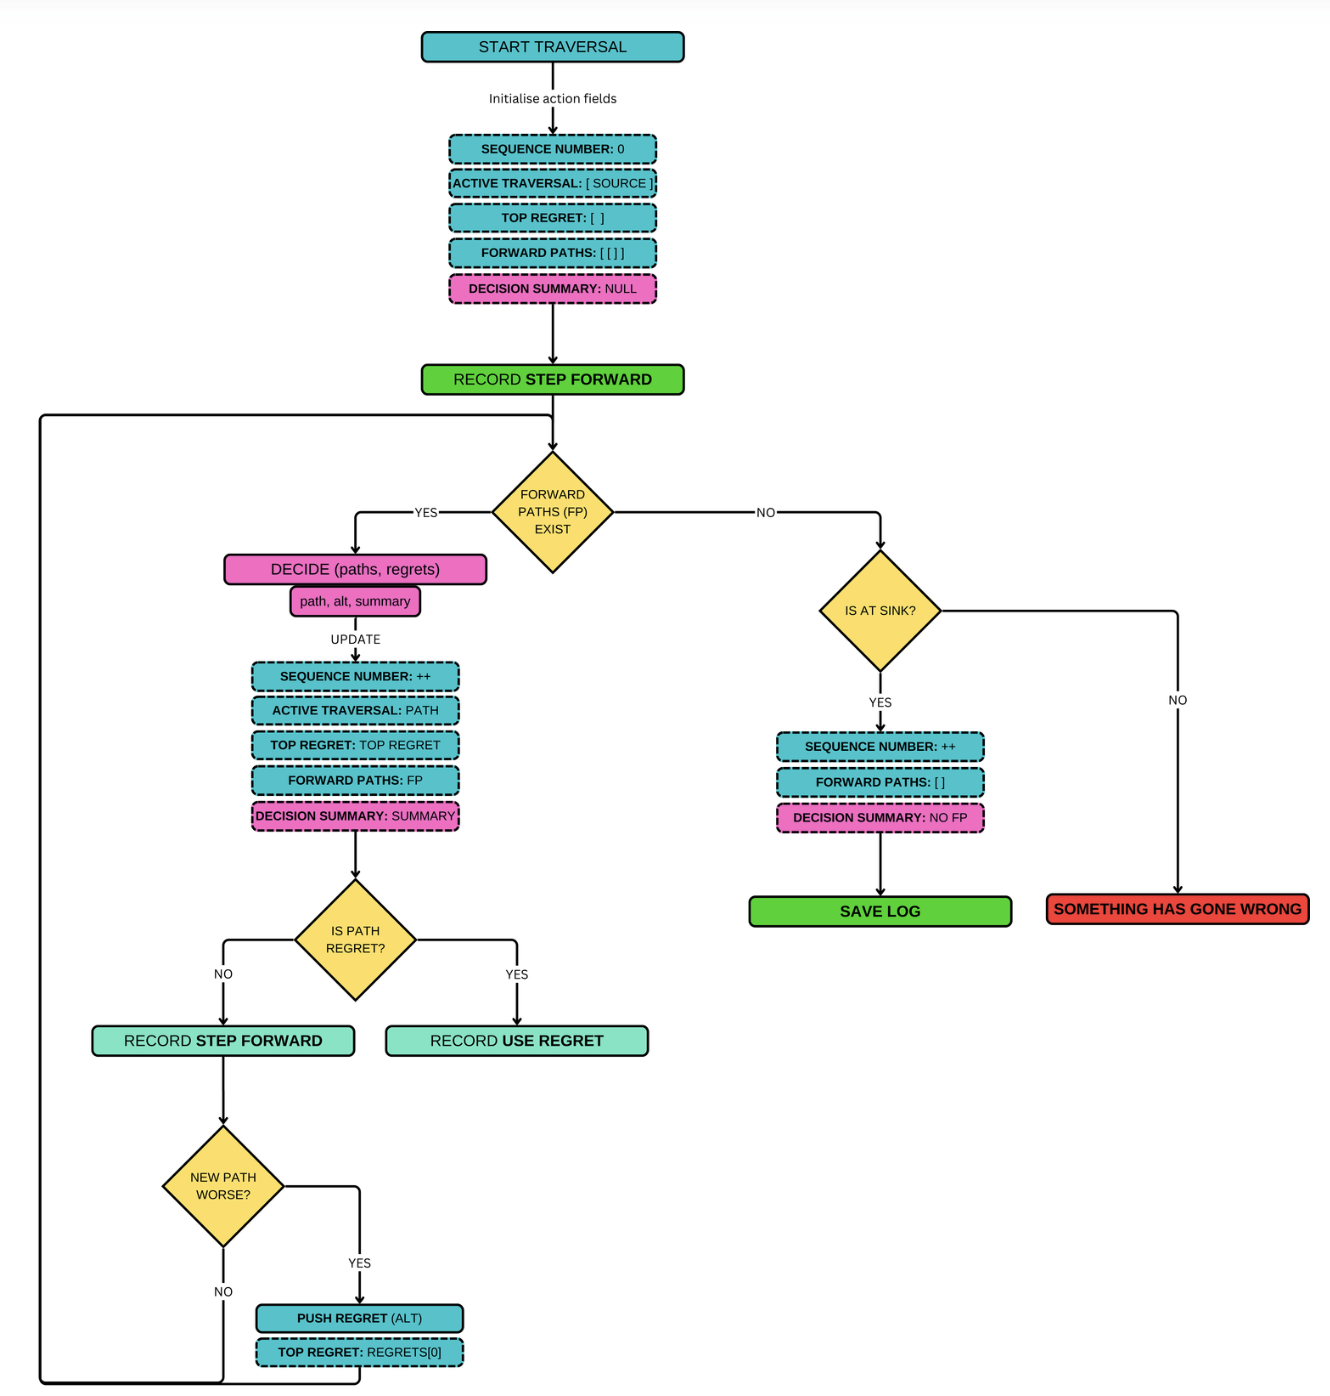
Eventually, as our traverser marches forward, it will hit a dead end. If it's standing on the sink node, it's done! If it isn't on a sink, it backtracks out from the dead-end and remembers that edge as a bad path to follow, treating it as if it has zero flow capacity whenever it sees it again.
Optimizing to avoid regrets
As we were building the solution, we realized that regrets are a useful tool for solving our problems, but they can also be costly if used unnecessarily.
We found the best way to avoid regrets was to pre-rank decisions in the traversal to prefer going to the node with the fewest paths forward. For example, if we find that t-shirts can only be produced in Brisbane, the traversal should try to route t-shirts first unless the decision engine tells us otherwise. This locks in that limited decision scope early and minimizes the opportunities to trigger regret cycles.
How did that order get there?
So, we can take a cart full of items and create a route from it, defining which production locations around the world will produce the items and the minimum number of shipments that will be created for the order. Based on the rules in the decision engine, we’re pretty sure it will send items where it's best.
But when someone asks why a set of items was sent where they were, we can’t just say, “Because the routing engine sent it there." We're not answering the question. We need to say exactly why it was sent there. That’s why we have routing logs.
When we run our traversal algorithm, we create a huge log of every decision made along the way. This includes every graph node seen by the traversal, every decision it made, and information on why it was made.
At each iteration of the main loop that drives the traversal algorithm, we create an action object. Information, including the possible paths forward from the current position, decision engine query results, and broadly, what type of action was taken, is all recorded in the action object.
At the end of a traversal, all the traversal actions, as well as some contextual state of the world data and a set of nodes seen throughout the traversal, are packaged into a single chunky object we call a routing log. We then stamp it with an ID and save it asynchronously to a key-value blob storage with an automated expiry.
The routing log’s ID is then carried throughout the checkout process and is attached to the resulting order. If there’s a question about that order or we notice something odd in the metrics, we can use the ID to investigate and debug the traversal.
Does it work?
Routing is a complex system to measure the success of. There are multiple components, each with independent responsibilities and different success conditions, so how do we decide if the system is successful?
Do we check that each component works and confirm its success by its sum? Well, that's one way. Another way is to confirm whether the system achieves the user outcomes it set out to achieve. Put another way, have we solved the problem we set out to solve in a way that delights our users?
At the start of this post, we called out the following outcomes being realized by routing:
- A delightful user experience and faster delivery.
- A decrease in environmental impact.
- Ease of use for our internal operations team.
But this is an engineering blog. While those product features are important for measuring success, we need to quantify them in some measurable way to understand if they've been met. When we think about success metrics, we need to consider the elements of the user experience that impact those outcomes.
To keep things concise, we’ll focus on success metrics related to the user experience. So, let's examine whether we can quantify how delightful Routing makes our user experience.
When it comes to the fulfillment and purchase of print orders, a delightful user experience is pretty straightforward to qualify:
- Accurate information about order timelines.
- Information available where a user needs it most, pre-purchase to understand their commitment.
- Information is reliably available. When users check out, they can be confident that they'll see the information they need.
- Information loads non-prohibitively. The user doesn’t have to wait a long time for it to become available before they can purchase.
Concisely, routing needs to always produce results and be fast. Really fast.
Reliable, accurate, and fast routing means a user can know exactly how long we anticipate their order to take before they purchase. Canva can guarantee accurate information by carrying it through to their purchase.
Speed is difficult, especially when we consider that we need to traverse large graphs potentially multiple times to generate a result. However, in our case, we managed to find the right balance.
Multiple rounds of testing enabled the identification of bottlenecks in our algorithm, which we could optimize by preprocessing our graphs and queries to improve performance.
We can proudly say that routing a Canva print order takes an average of 50 milliseconds at the 99th percentile during usage peaks and as low as 5 milliseconds outside peak times. At our 50th percentile, we see an average time to route of 30 milliseconds or lower.
Our use of ElastiCache and Redis and the considered use of read replicas means that the information needed to route orders is always available and readable with 99.999% availability.
With those figures, it's easy to call Routing a success. Try it for yourself. Check out Canva Print, and keep an eye on that Checkout page!

