Backend
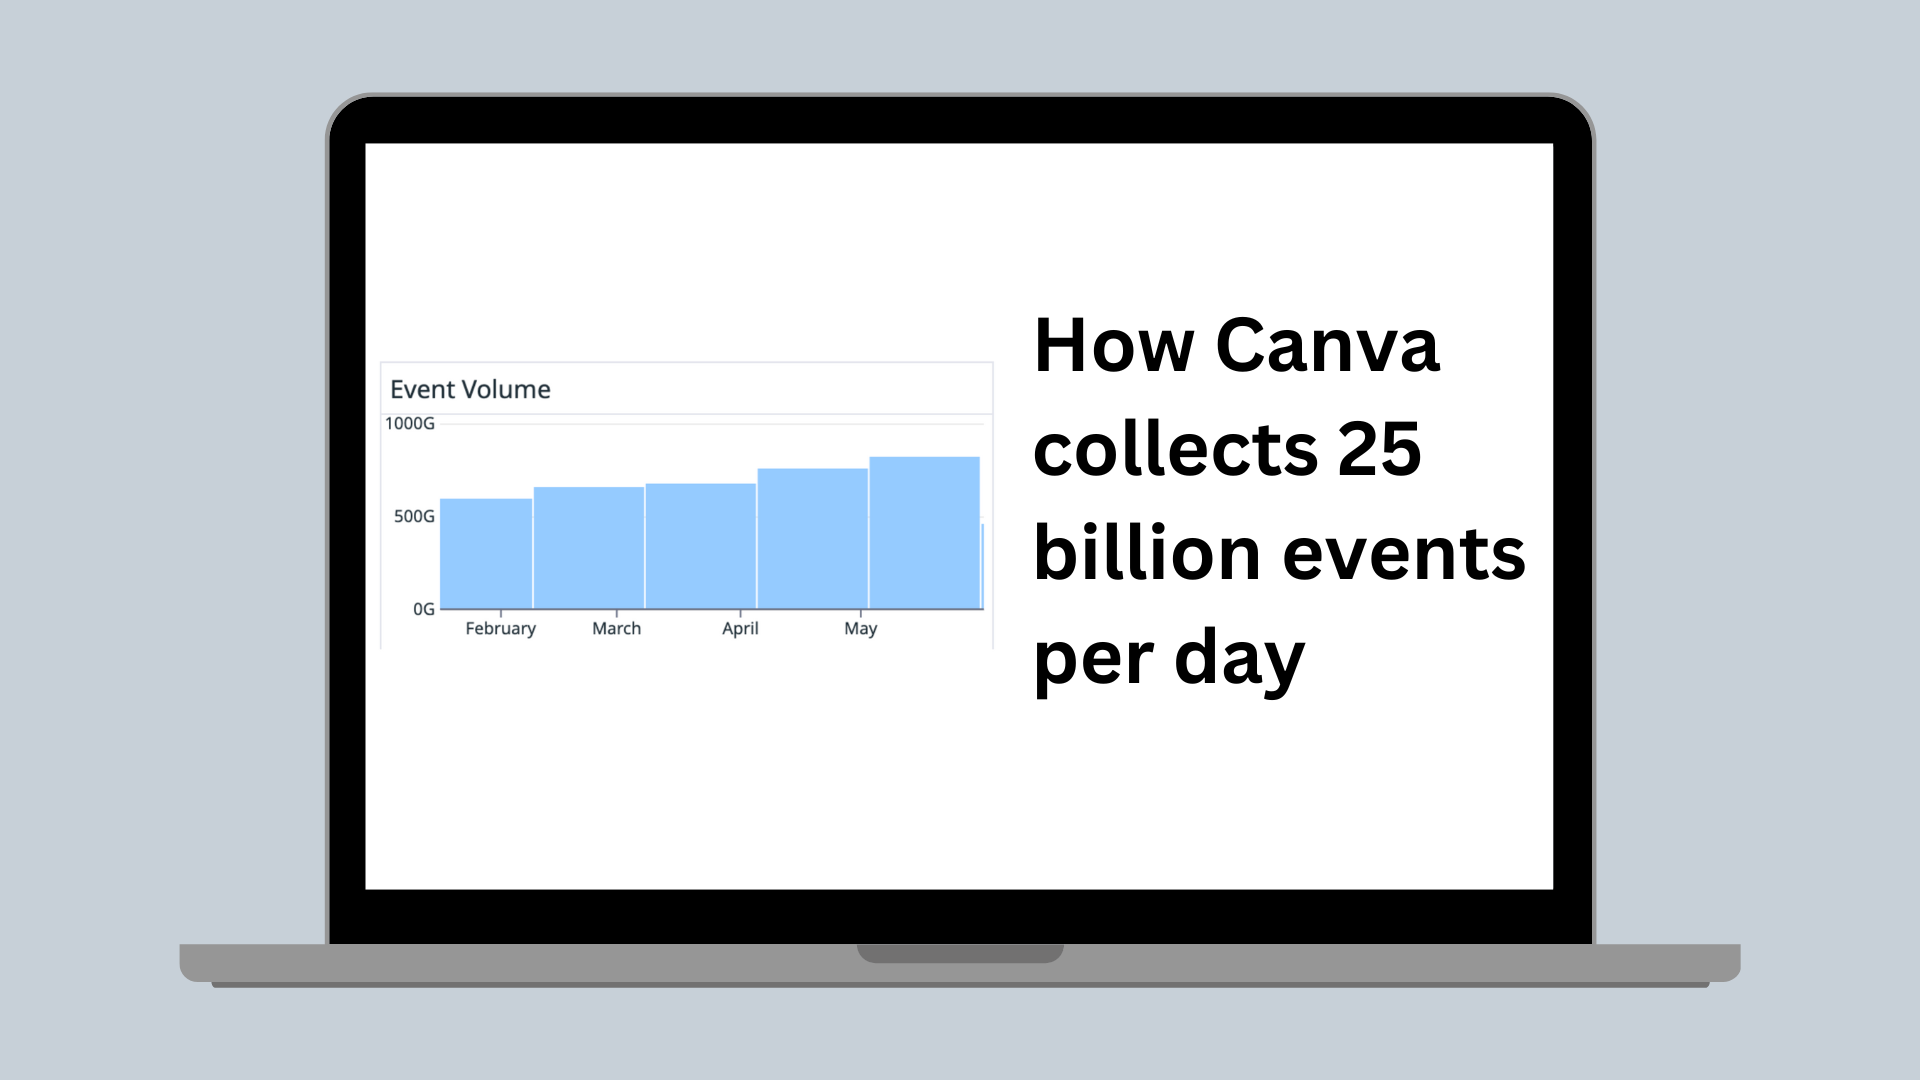
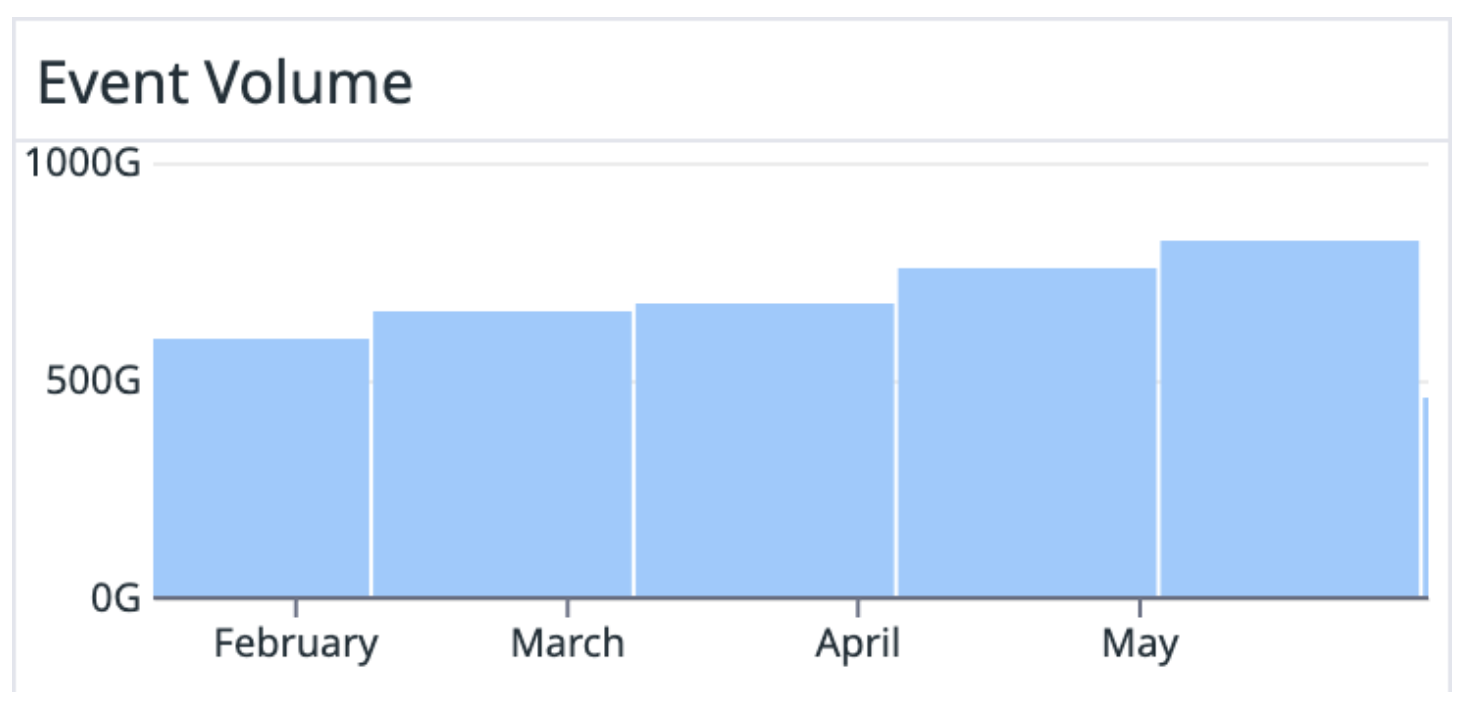
How Canva collects 25 billion events per day
The architecture of our product analytics event delivery pipeline.
At Canva, product analytics plays an important role in helping teams measure the impact of their product features and, subsequently, make data-driven decisions. New features are A/B tested to make sure we only release features that provide a better user experience. Our product analytics pipeline also powers various user-facing features, including personalization and recommendations, statistics on the number of design views, insights on member activities, and template usage for team administrators.
These use cases are powered by a stream of analytics events at a rate of 25 billion events per day (800 billion events per month), with 99.999% uptime. Our Product Analytics Platform team manages this data pipeline. Their mission is to provide a reliable, ergonomic, and cost-effective way to collect user interaction events and distribute the data to a wide range of destinations for consumption.
We’ve divided our team mission into 3 categories: structure, collect, and distribute.
Structure
At our team’s inception, a key decision we made, one we still believe to be a big part of our success, was that every collected event must have a machine-readable, well-documented schema.
syntax = "proto2";import "datumgen/datumgen.proto";package events.page;// Fired when the user visits a page.message PageVisitedEventProperties {option (datumgen.event_type) = "page_visited";// The name of the page.optional string page_name = 1;// The flag indicates if the page is embedded in the iframeoptional bool is_iframe_embedded = 2;}
Because all Canva engineers were already familiar with using the Protobuf(opens in a new tab or window) language to define contracts between microservices, we decided to re-use the same language to define the analytics event schema, with one extra special rule: event schema must have full transitive compatibility. That is, schemas must be forward- and backward-compatible, meaning we can use any schema version to deserialize any version of an event. We store analytics events indefinitely, so systems must be able to read:
- Old data using newer schema. When an old client fires an event with an outdated schema, we should still be able to process it.
- New data with older schema, for example, if a consumer in production is out of date or replaying history.
The only way to make a breaking change to a schema (such as adding or removing a required field) is to create a completely new schema.
Why do we need such a restrictive evolution rule? Usually, a Protobuf schema is used for service-to-service APIs, and we only have to maintain compatibility until we’re sure all consumers and producers have updated to the newest version. Meanwhile, our event schemas are a type of persistence schema, defining the shape of the data stored at rest (for example, in our Data Warehouse). A Data Scientist using our tools today, with the current set of schema versions, should be able to read event data created from 3 years ago. Similarly, event data created today should also be readable using any future schema versions years from now. To support a breaking change in a schema, we’d need to perform a data migration of all historical event data into the new schema. Because an event could have years of historical data, this would be time-consuming and costly.
To automatically enforce the rules, we built our own code generator on top of protoc, which we call Datumgen. We define and store all our event schemas in our repository alongside product code. When someone creates or updates an event schema, Datumgen is triggered to verify that the schema version follows compatibility rules and generates code in multiple languages to assist with sending and consuming events.
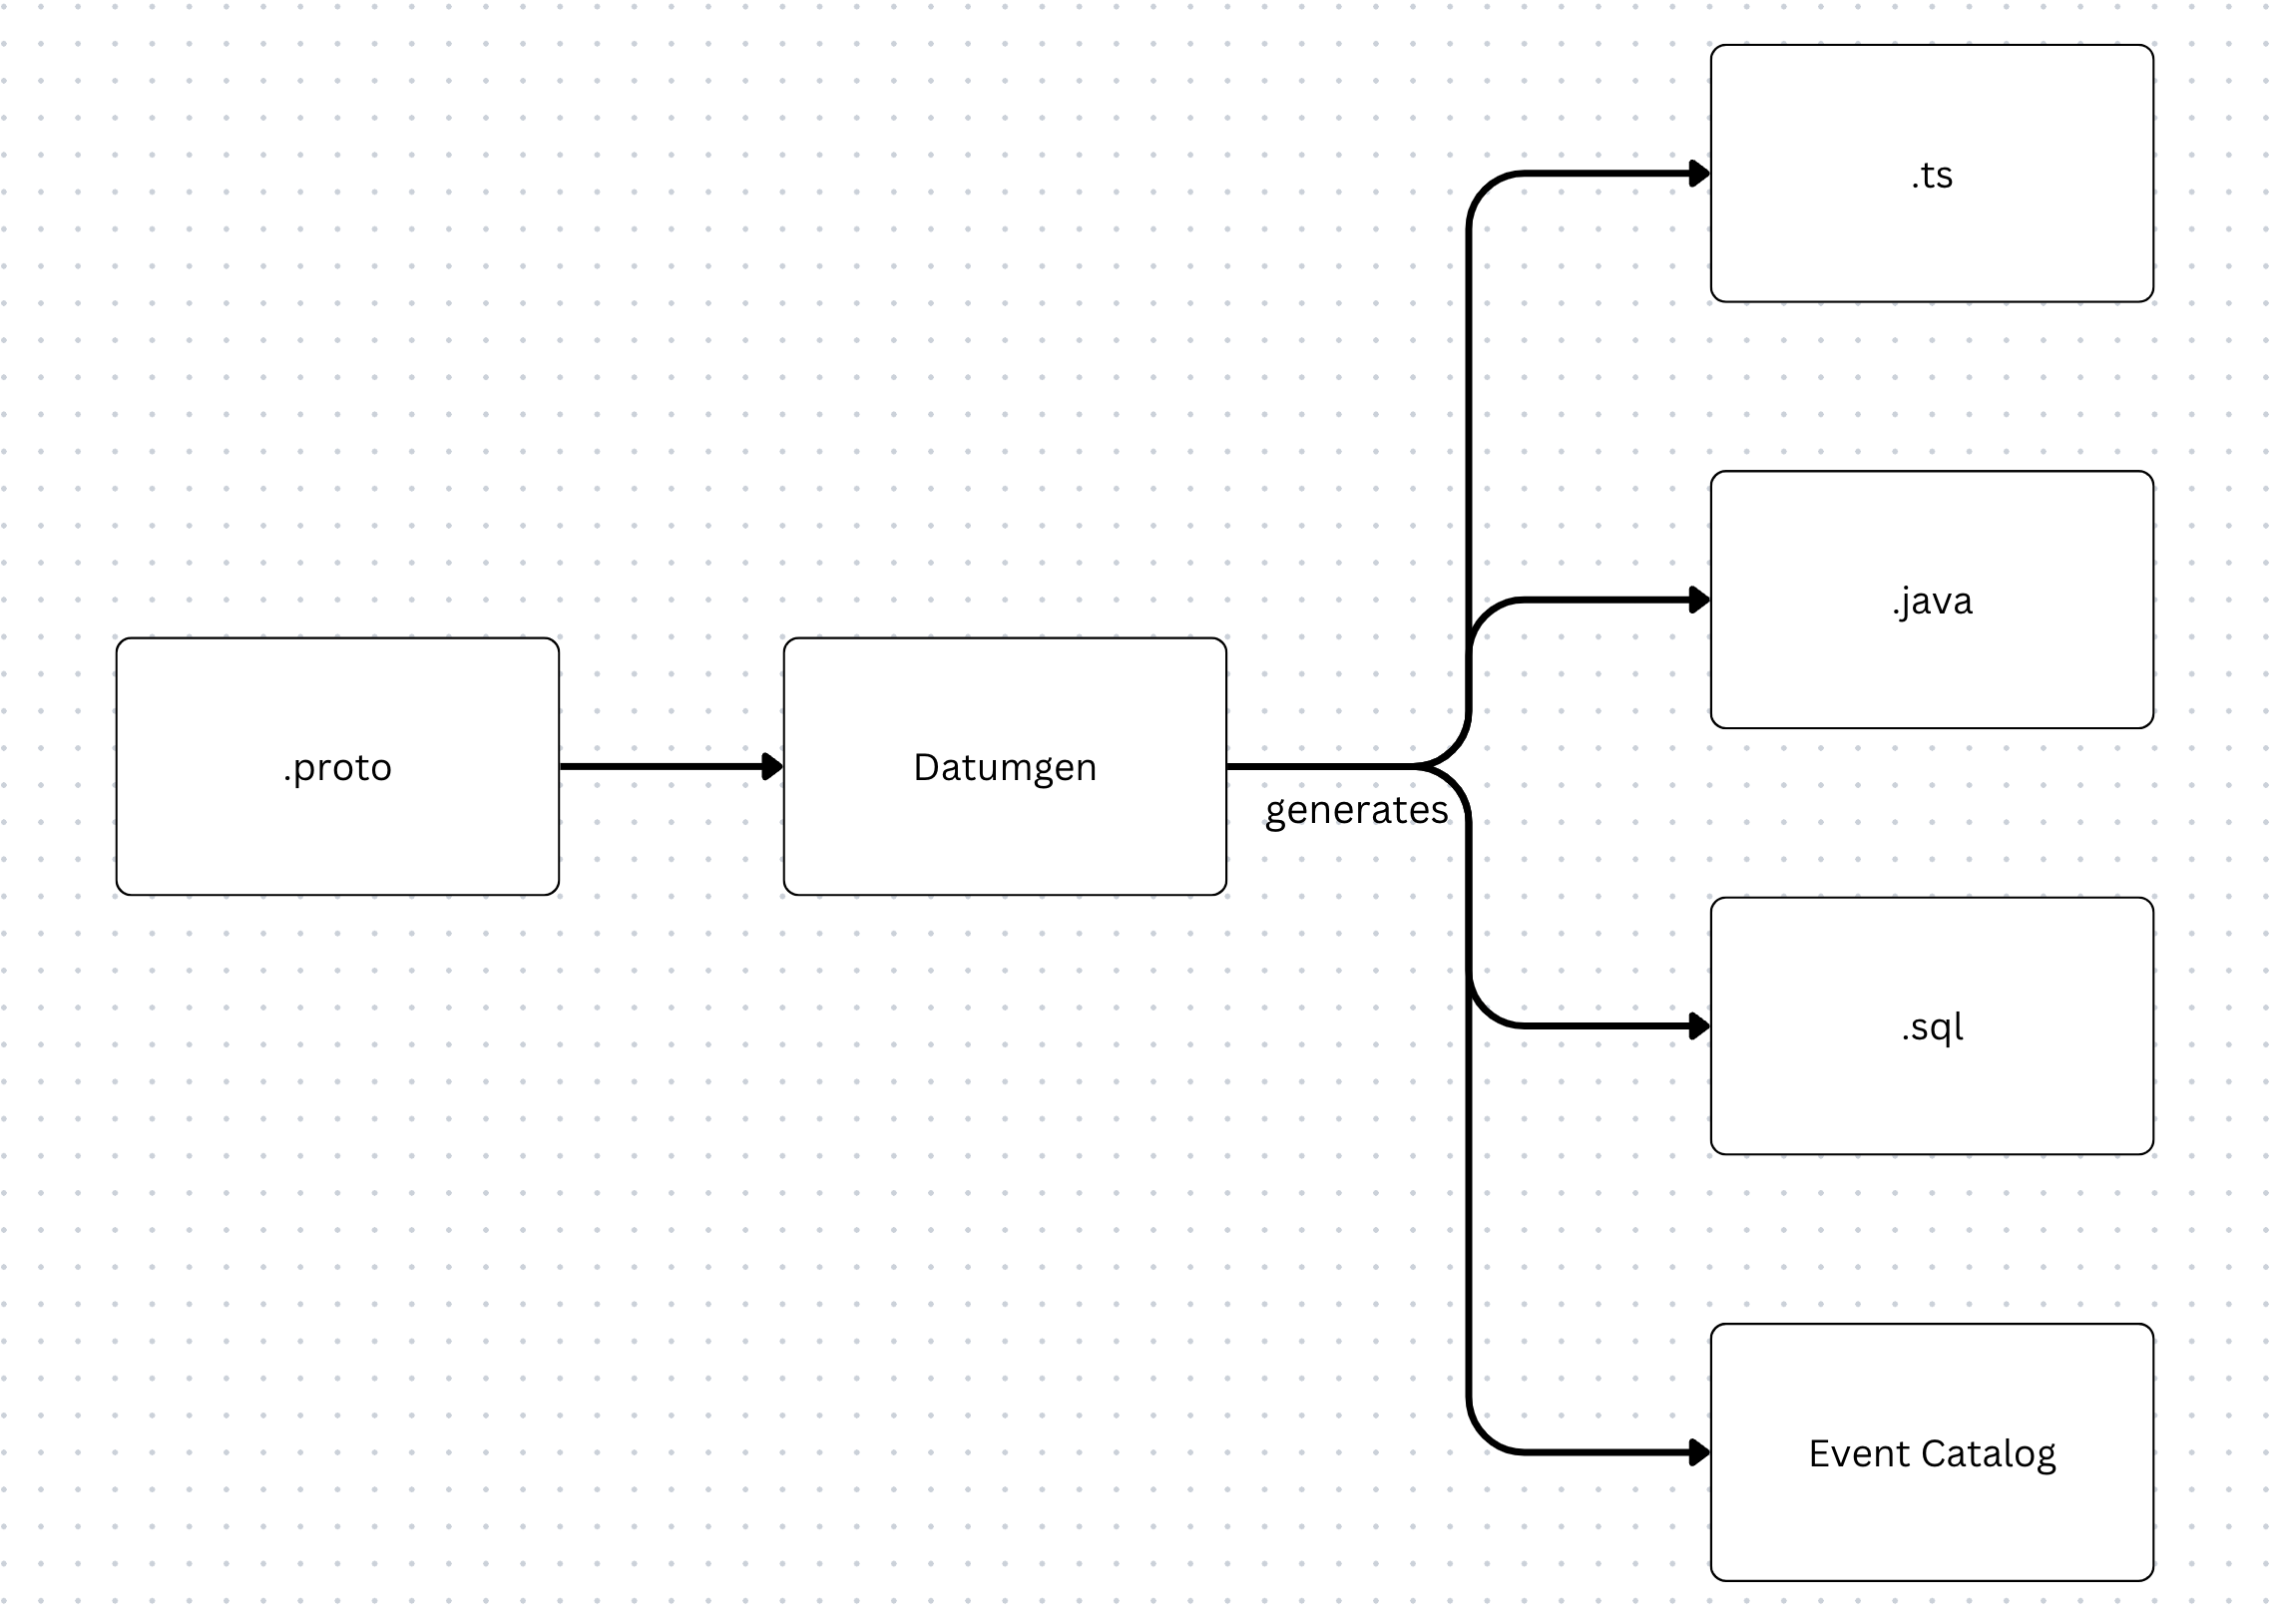
Datumgen generates:
- Typescript definitions: Used by the Canva frontend to enable compile-time type checks for every event fired.
- Java definitions: Used to send events from the backend servers and for consuming events in Java processes.
- SQL definitions: Used to define table schemas in Snowflake.
- Event Catalog: Used to render a searchable event catalog UI, where anyone in Canva can explore the events we collect, the fields they contain, and where they’re delivered. With over 2000 unique event types (and more added weekly as the Canva feature set continues to expand), this is an important tool to assist in data discovery and minimize duplicate work between teams.
Writing our own code generation tool also allowed us to add a couple of extra rules to make sure the schemas are well maintained and up-to-date. Every event must have:
- Two owners to make sure every event in our catalog is up-to-date and has a clear purpose:
- Technical owner: Responsible for the code that fires the event. For new events, the technical owner is usually the pull request (PR) author. This would typically be a frontend or backend engineer.
- Business owner: Knows about the context and structure of the event. Business owners are typically Data Scientists.
- Comments explaining its purpose and the meaning of its fields. Comments serve as documentation in the event catalog and the Snowflake table schemas.
By making sure every event fired conforms to a known schema before it reaches our collection endpoint, we can:
- Massively reduce the effort needed to clean the data.
- Make sure we never accidentally break downstream data consumers by making incompatible schema changes.
- Empower every Canvanaut to discover and extract insights from our existing catalog of events.
Collect
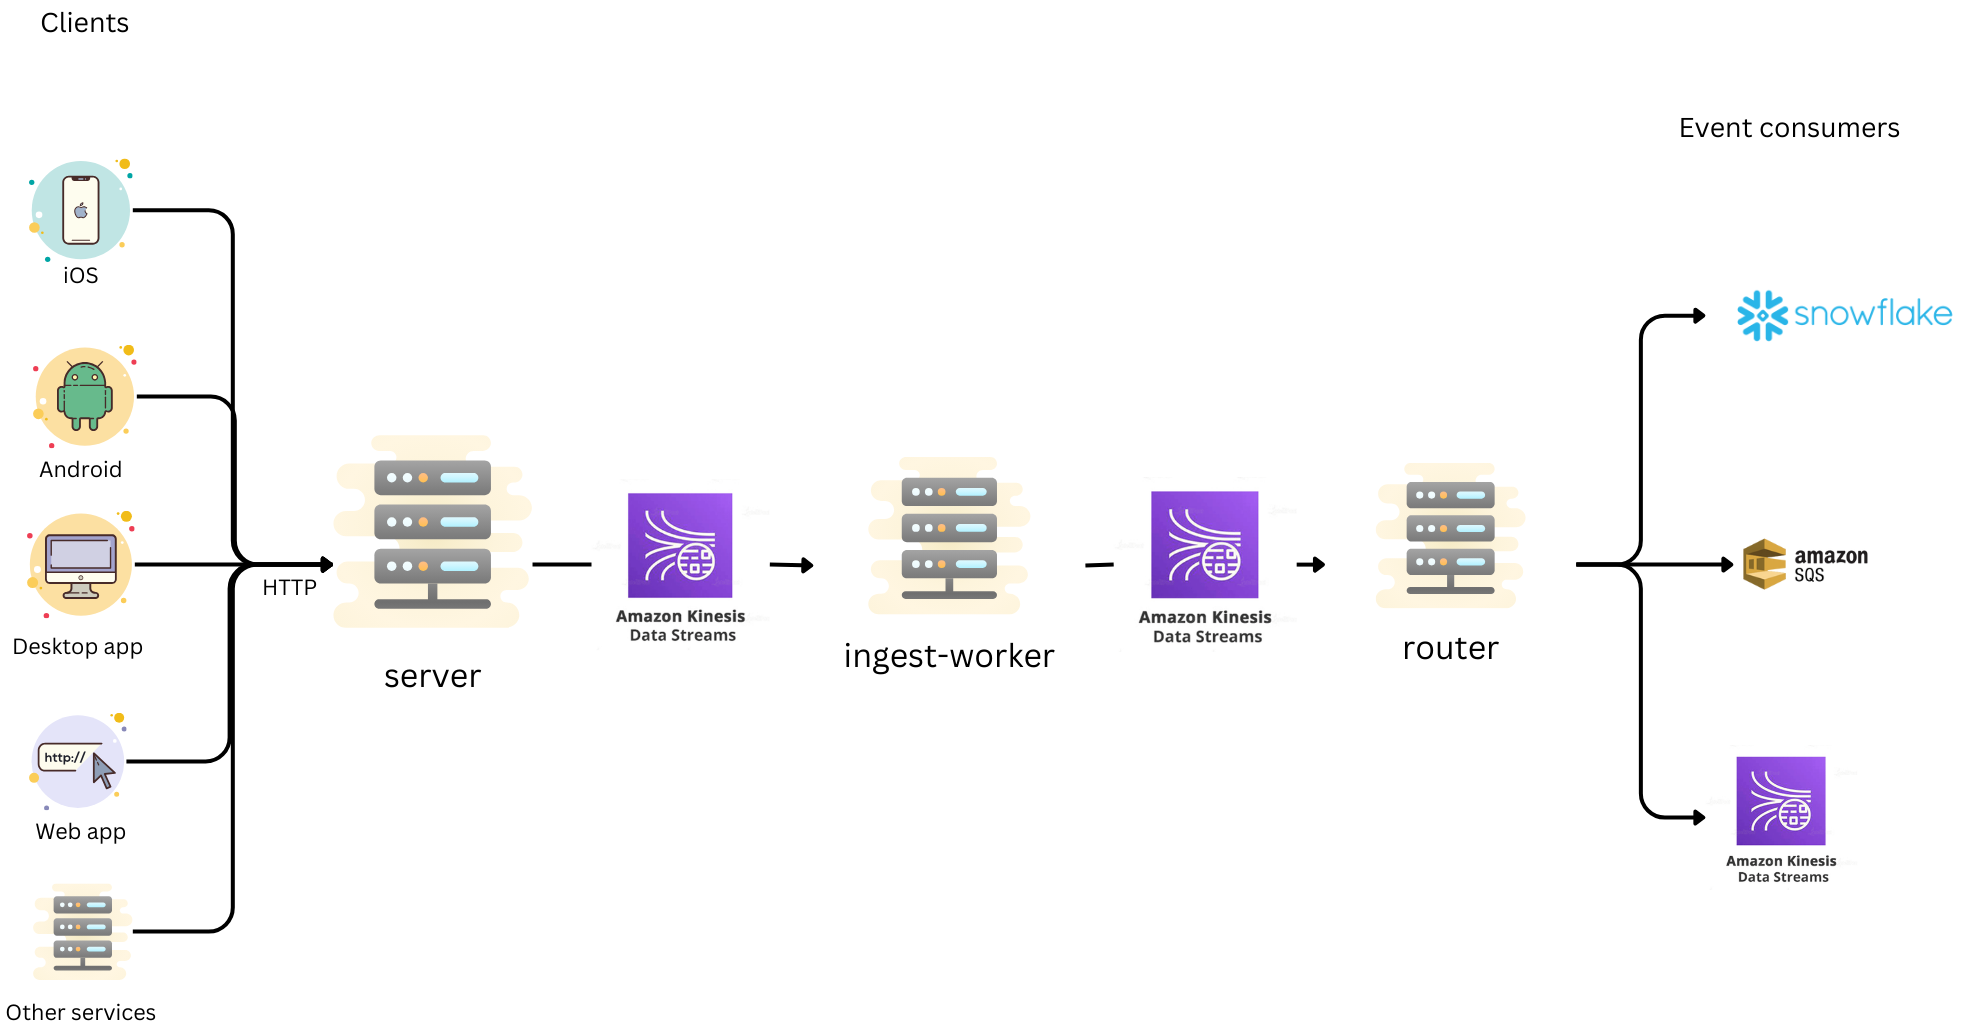
The journey of an analytics event starts with the Canva application. We maintain a set of analytics clients for the various platforms that Canva can run on. To reduce the surface area that our team has to cover and minimize maintenance effort, all front-end analytics clients share the same core library underneath, written using TypeScript and running inside a WebView environment(opens in a new tab or window). We only need to communicate with the native application to retrieve information about the device. This way, our team maintains only a single client codebase, plus some very simple APIs for retrieving device details.
We then collect all events through an endpoint in our server. The server validates that every event received conforms to a predefined schema before sending them to the ingest-worker asynchronously through a Kinesis Data Stream (KDS). Any events with invalid schemas are discarded.
Inside the ingest-worker, we perform some transformations, enriching the events with more details such as country-level geolocation data, user device details, and correcting client-generated timestamps(opens in a new tab or window). Having a separate worker do this processing means we can do as much work as we need and depend on other services without compromising the response time of the collection endpoint in the server. When all the enrichment work is done, the events are forwarded to another KDS to make their way to the router. For more information about the router, see Distribute.
Why Kinesis Data Stream?
In the early MVP version of the pipeline, we used AWS SQS and SNS as our streaming platform between components because it was easy to set up, very resilient, and able to autoscale without manual management effort. However, with great convenience came a great cost (literally!). Our SQS and SNS bills took up around 80% of the cost of running our entire service.
Therefore, after running the MVP version, one of our first goals was to migrate away from SQS and SNS. Because Canva was running entirely on AWS, we decided to stay with AWS offerings and explored 2 options: Amazon Managed Streaming for Apache Kafka (MSK) and Amazon Kinesis Data Stream (KDS). We ran the same load tests on both MSK and KDS to compare various aspects between the 2 services:
- Cost: Although MSK would reduce costs by 40% compared to SQS/SNS, KDS was the clear winner, reducing the costs by 85%.
- Performance: MSK’s latency was around 30% lower compared to KDS, but in absolute numbers, this was only a 10-20ms difference.
- Maintenance: KDS is extremely low maintenance. The only setting we need to change is the number of shards on a stream, which influences how much throughput a stream can take. Alternatively, MSK requires a lot more tuning, including the number of brokers, number of partitions, disk space, memory size, and much more.
In summary, even though MSK wins in terms of raw performance (minimally), it doesn’t outweigh its extra maintenance effort and higher price. By switching from SQS and SNS to KDS, we were able to reduce the cost by 20 times.
Compression
Another quick and easy optimization that allowed us to achieve big savings on the KDS cost was compressing the data before sending it to the stream. Instead of sending each event as a separate record, we grouped them into batches of a few hundred events, applied zstd(opens in a new tab or window) compression, and sent the compressed payload as a single record. Because analytics events usually have a lot of repeated data, we achieved a 10x compression ratio while only taking about 100ms per batch to compress and decompress the data. According to our estimates, implementing compression saved us $600K/year in AWS costs.
SQS fallback
Running KDS isn’t always straightforward. Although the average latency of KDS is pretty good (around 7 ms), it does suffer from high tail latency (greater than 500 ms). Furthermore, each KDS shard has a hard limit of 1MB/s write throughput, so sometimes, a shard could be overloaded for a short period of time. We could wait a bit and retry the failed write operation later, but that would significantly increase the response time at the server, which we're trying to avoid.
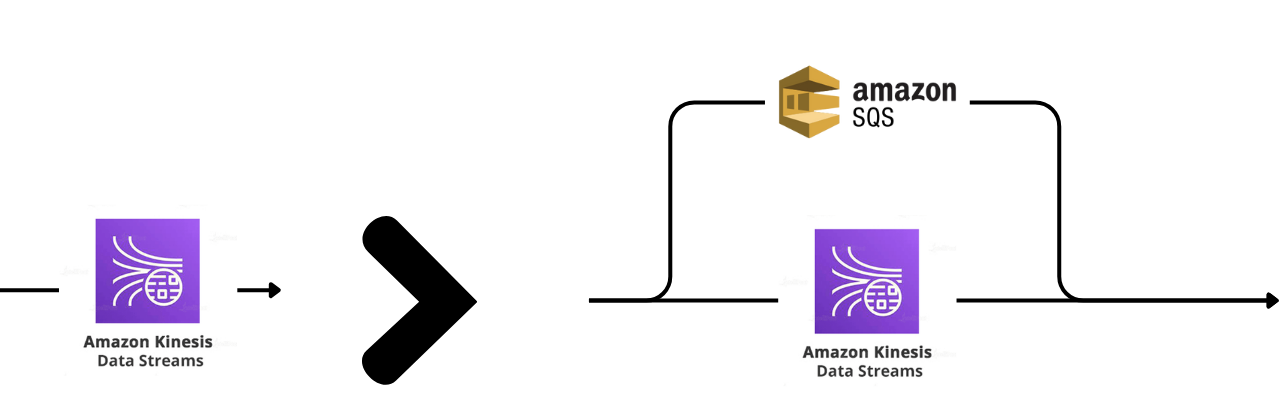
The solution for both of these problems was to send events to an SQS whenever we were throttled by a KDS shard or whenever we spend too much time waiting for a KDS response. Essentially, we’re using SQS as an overflow protection for KDS. As a result, we kept our response time p99 consistently less than 20 ms, for less than $100/month spent on SQS.
As an added benefit, we also get a failover mode. In the unlikely case of an outage or severe degradation of KDS, we can redirect the entire event stream to SQS and keep the service running with no downtime.
Distribute
We made a conscious decision to decouple the router from the ingest-worker. The analytics event stream supports a multitude of different consumer types, which could have different requirements and performance characteristics. Including the routing logic in the ingest-worker might seem like a simpler option, but that would mean introducing a heavy coupling among the data consumers. A delay on one data consumer could delay data for all consumers. With a decoupled router, we have the flexibility to implement different router types based on consumer characteristics or priority level.
When an event makes its way to the router, it’s ready to be distributed to consumers. We declare all consumers in configuration files in the repository and deploy them together with the router.
We deliver all event types into Snowflake using Snowpipe Streaming(opens in a new tab or window). This is what the majority of models, dashboards, and analyses use as their data source.
For other backend services wanting to consume the event stream in real time, such as for personalization and recommendation, we support 2 subscription types: KDS and SQS. For services wanting to consume only 2-3 event types, we usually recommend an SQS queue because of its ease of maintenance. For services wanting to consume 100s of events, we recommend KDS because of its cost-effectiveness.
Deduplication
Our service provides an at-least-once guarantee. When an event is accepted by the server (a 200 OK response), it’s guaranteed to be delivered to all subscribed consumers at least once. This means that sometimes, duplicate copies of the same event will be delivered. It’s up to each consumer to perform deduplication if necessary.
Acknowledgements
A huge thanks to Arthur Baudry(opens in a new tab or window), Jack Caperon(opens in a new tab or window), Yunlong Wang(opens in a new tab or window), and Kevin Jung(opens in a new tab or window) for your reviews and feedback to make sure the information is correct. Thank you Grant Noble(opens in a new tab or window) for helping us out with the technical writing feedback.