Snowflake
Our journey to Snowflake monitoring mastery
How I learned to stop worrying and love metadata.
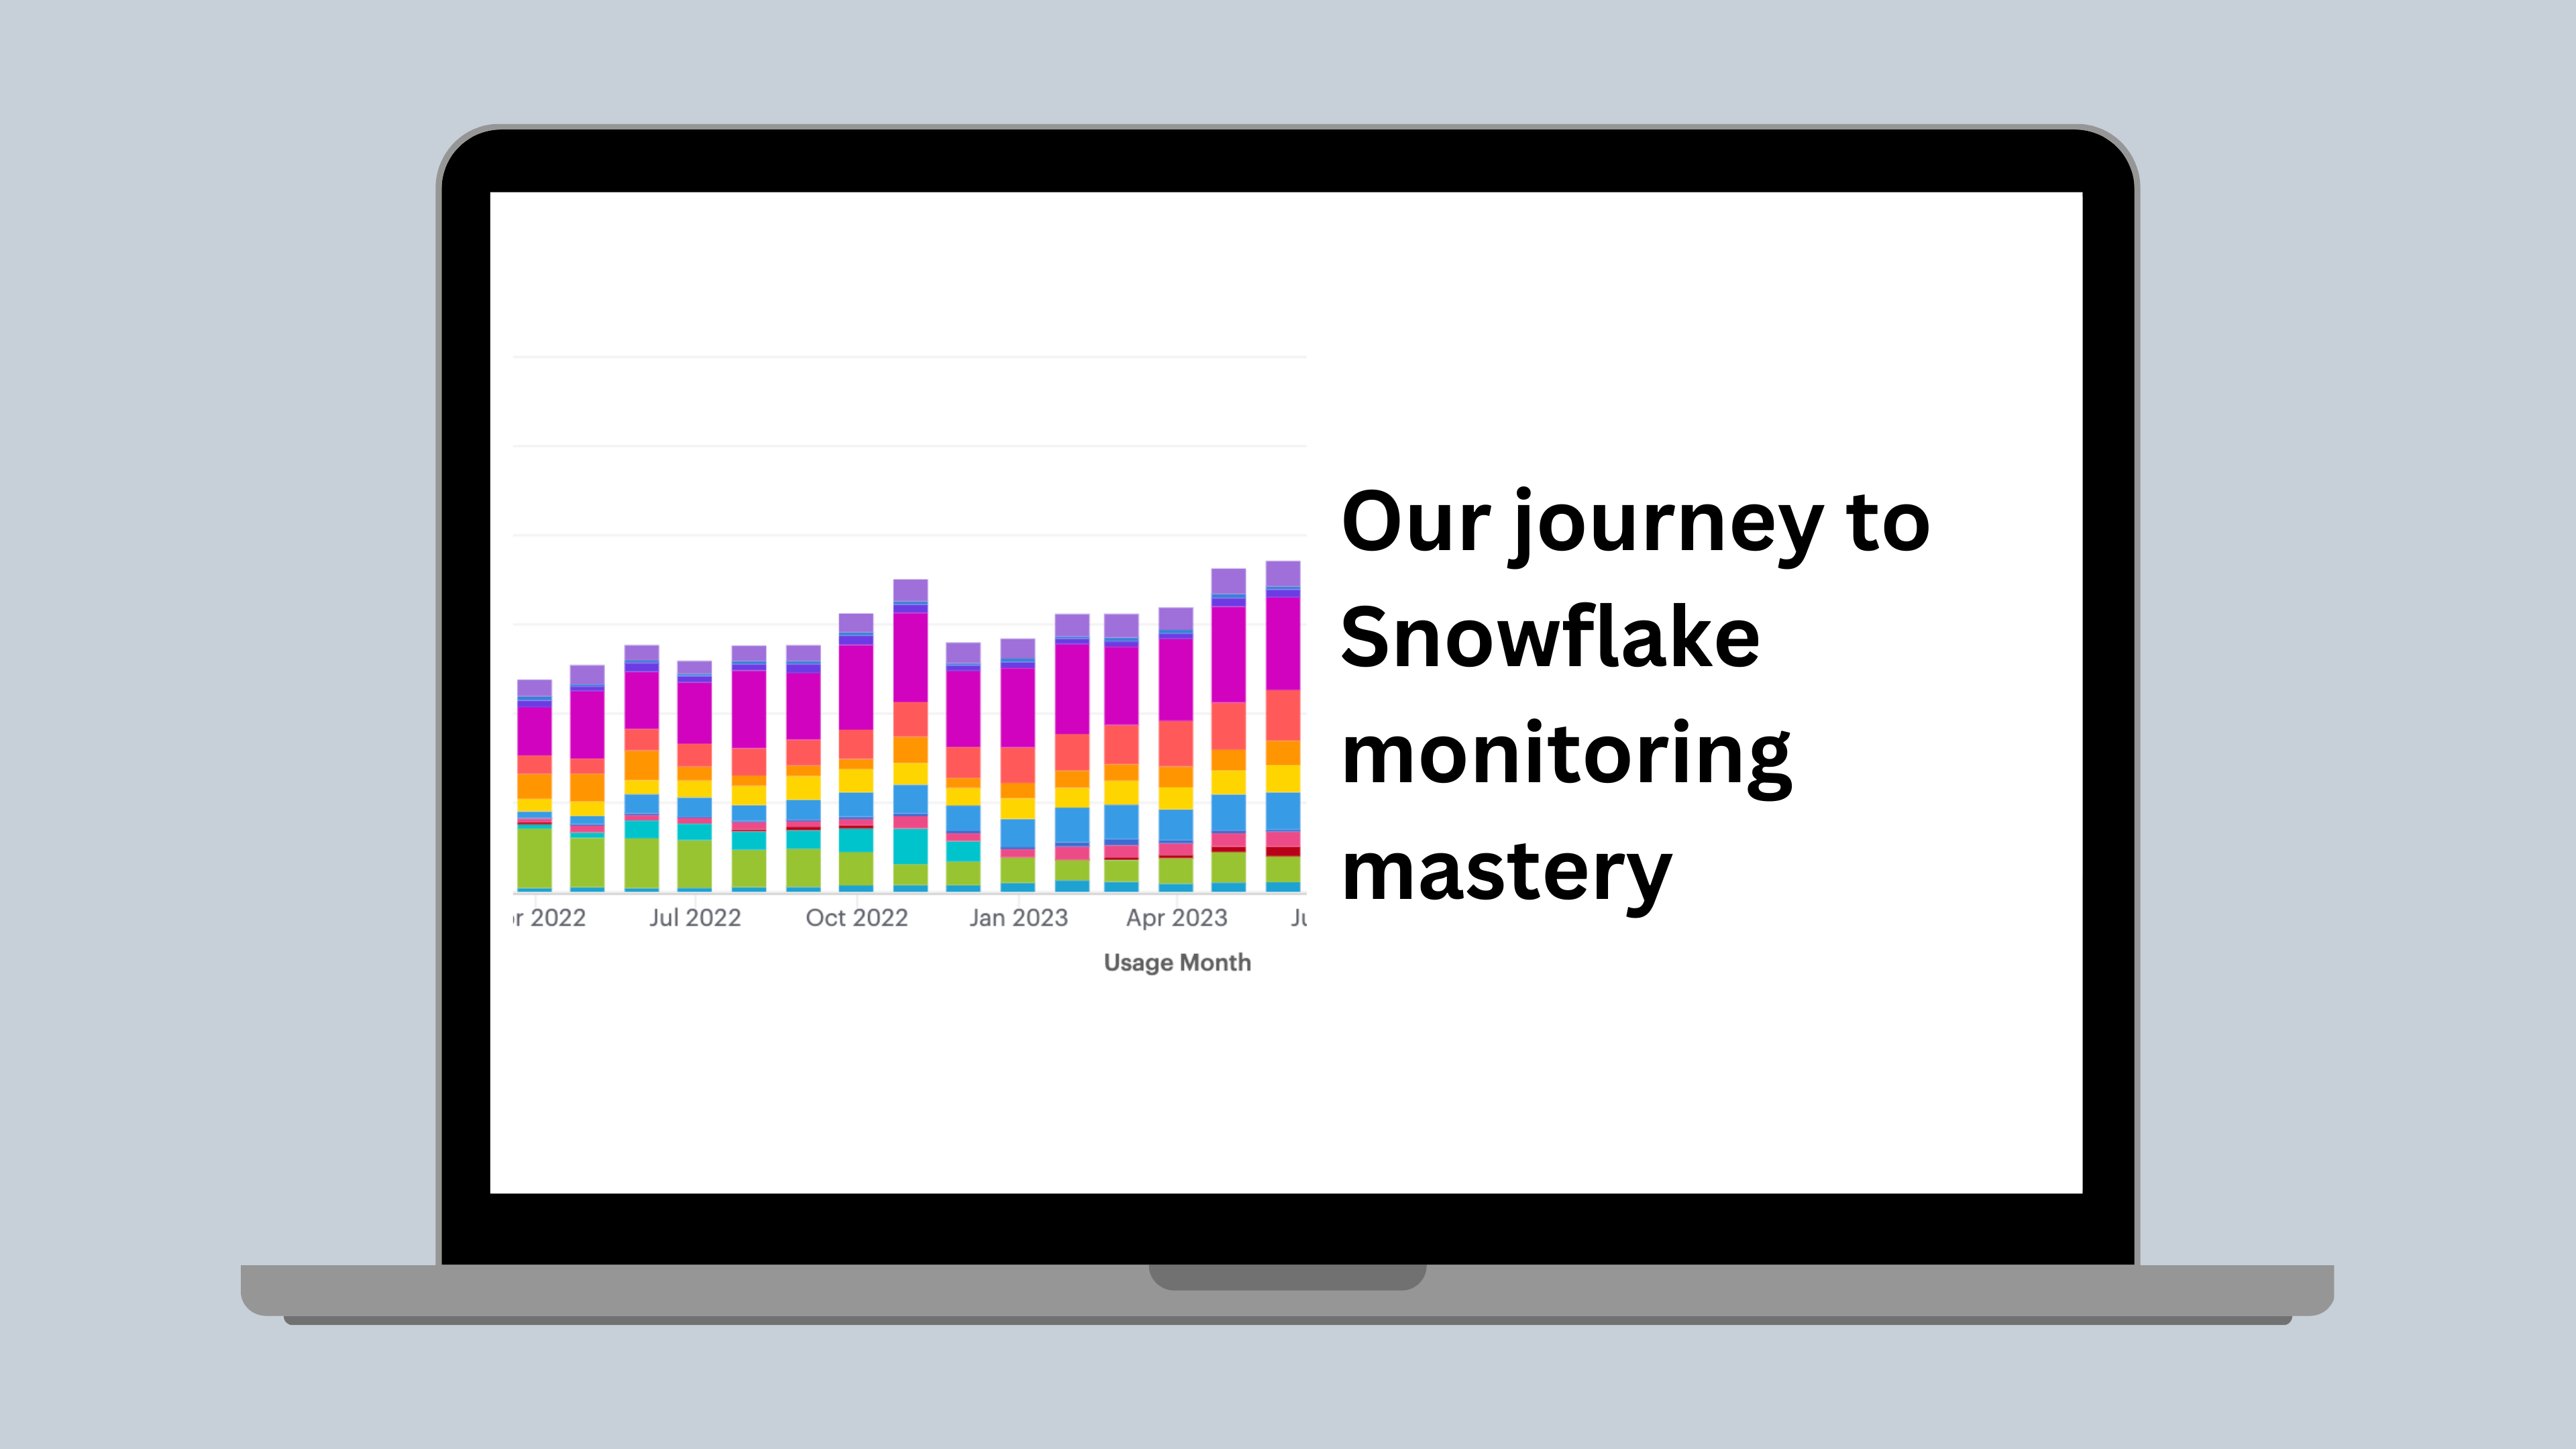
We’re big fans of Snowflake, and for good reason. Its ability to enable teams across Canva is a game-changer, mainly because SQL is such a prevalent skill set today. Snowflake’s user-friendly data management approach lets us extend its usage far beyond the typical data warehousing tasks. The ongoing enhancements and new features Snowflake continues to roll out are pushing the boundaries of what’s possible, allowing us to explore use cases unlocked with functionality such as Streamlit and Declarative Pipelines (Dynamic Tables).
The platform has become deeply integrated into our daily operations and is used extensively across Canva. It’s not just the engineering teams that benefit from Snowflake; designers, product managers, and even sales teams leverage it to drive insights and improve decision-making. In fact, over two-thirds of Canva interacts with Snowflake in some capacity, whether through direct querying, using data-powered dashboards, or indirectly through downstream tools that draw from our data warehouse.
Our data platform
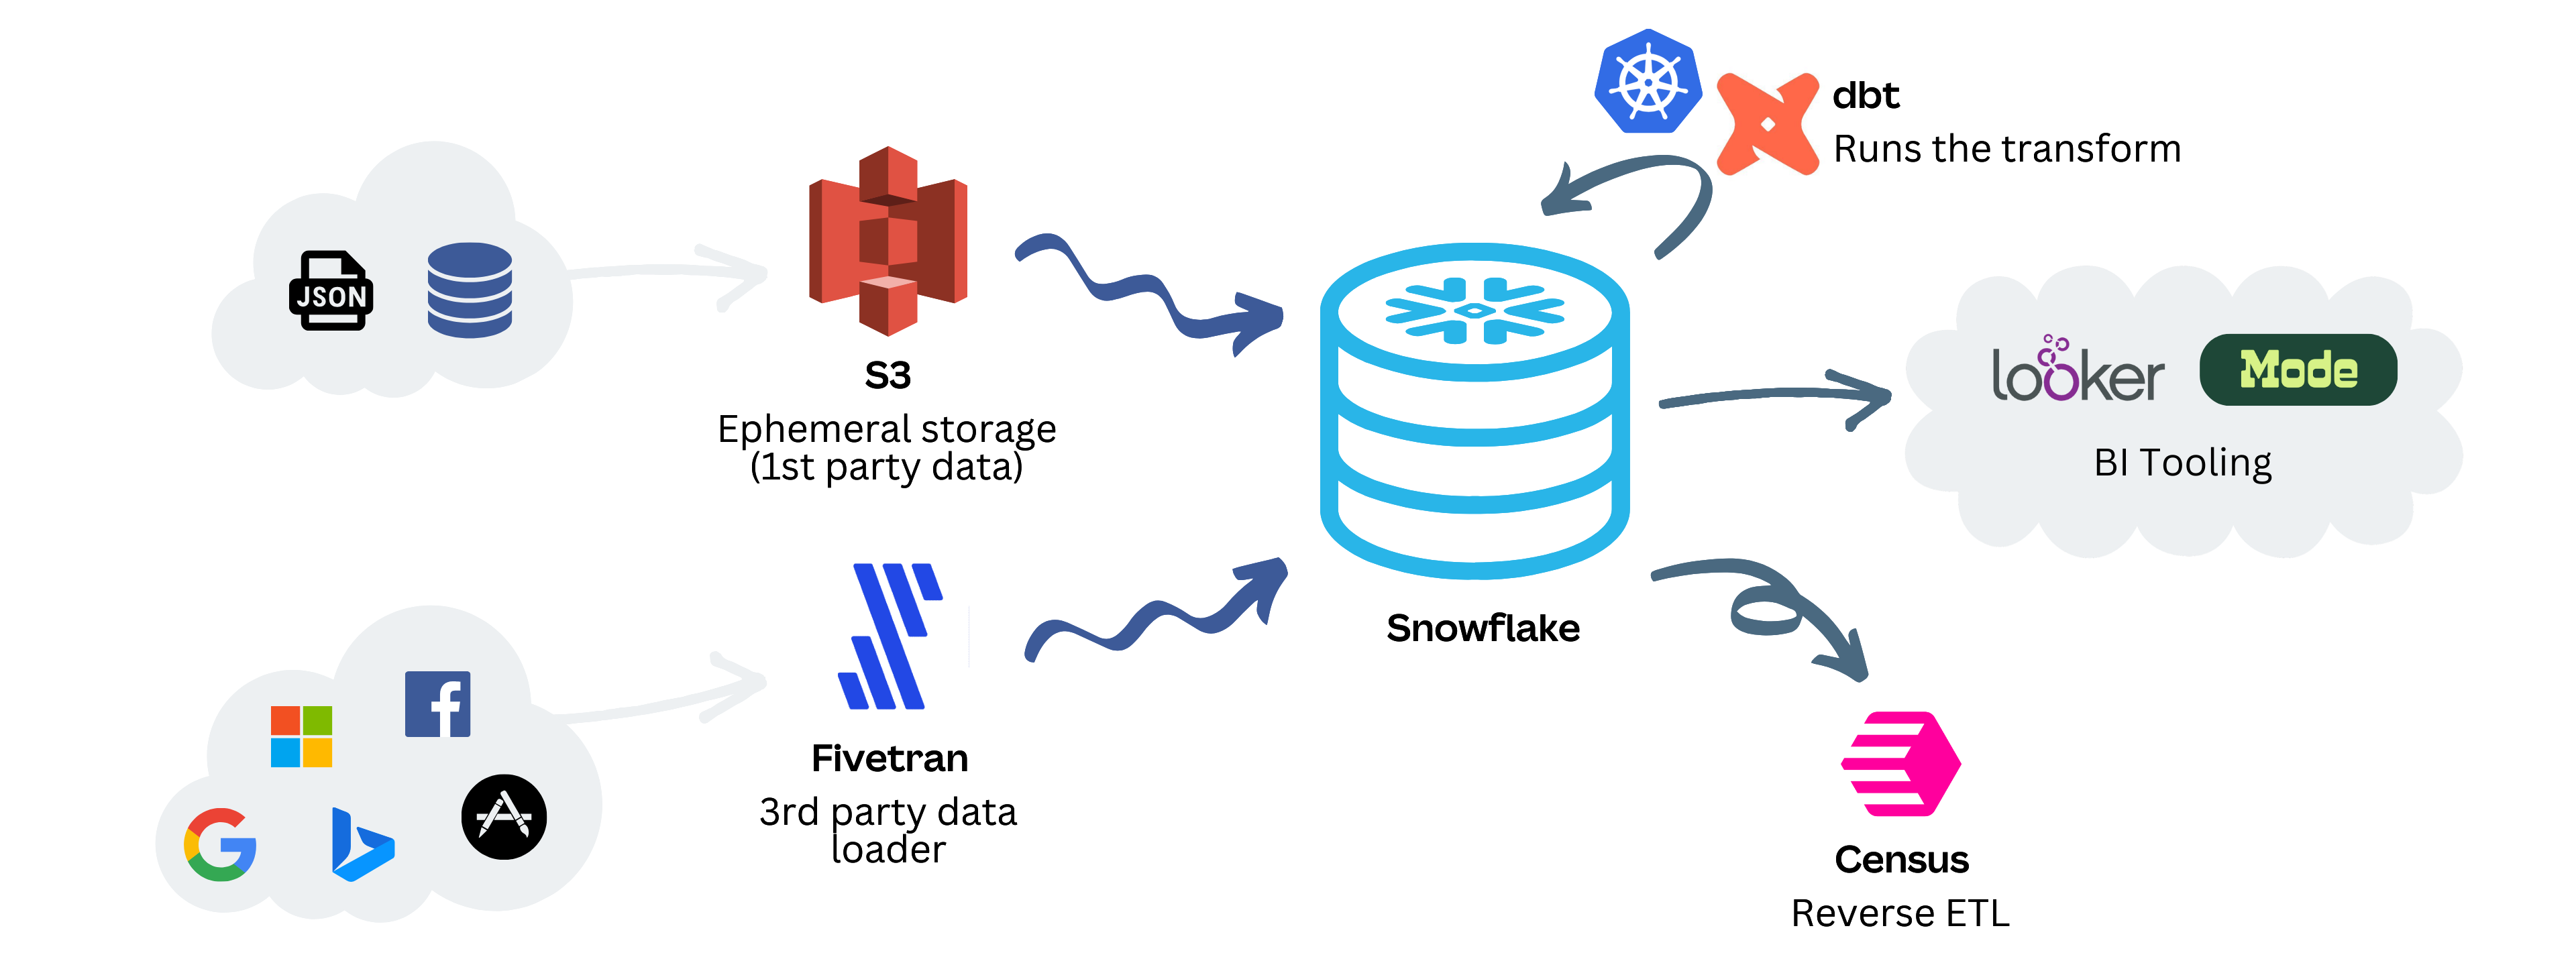
We designed our data infrastructure to be efficient and scalable. We ingest first-party data into Snowflake through Amazon S3, ensuring a seamless pipeline from our internal systems. For third-party data, we rely on Fivetran(opens in a new tab or window) to handle the heavy lifting of ETL (Extract, Transform, Load) processes. This data flows into Snowflake and is exposed through external tables. From there, dbt(opens in a new tab or window) (data build tool) steps in, orchestrating our data transformations to ensure that raw data is shaped into a format that supports analysis and reporting.
The last part of our data journey involves making our data actionable. For that, we use Census(opens in a new tab or window) to synchronize enriched datasets back to our third-party systems, empowering tools and teams with fresh insights. On the analytics front, Looker(opens in a new tab or window) and Mode(opens in a new tab or window) are our primary tools for data visualization and exploration. They connect directly to Snowflake, letting users slice and dice data, build dashboards, and extract insights—all while taking advantage of Snowflake’s robust performance and scalability.
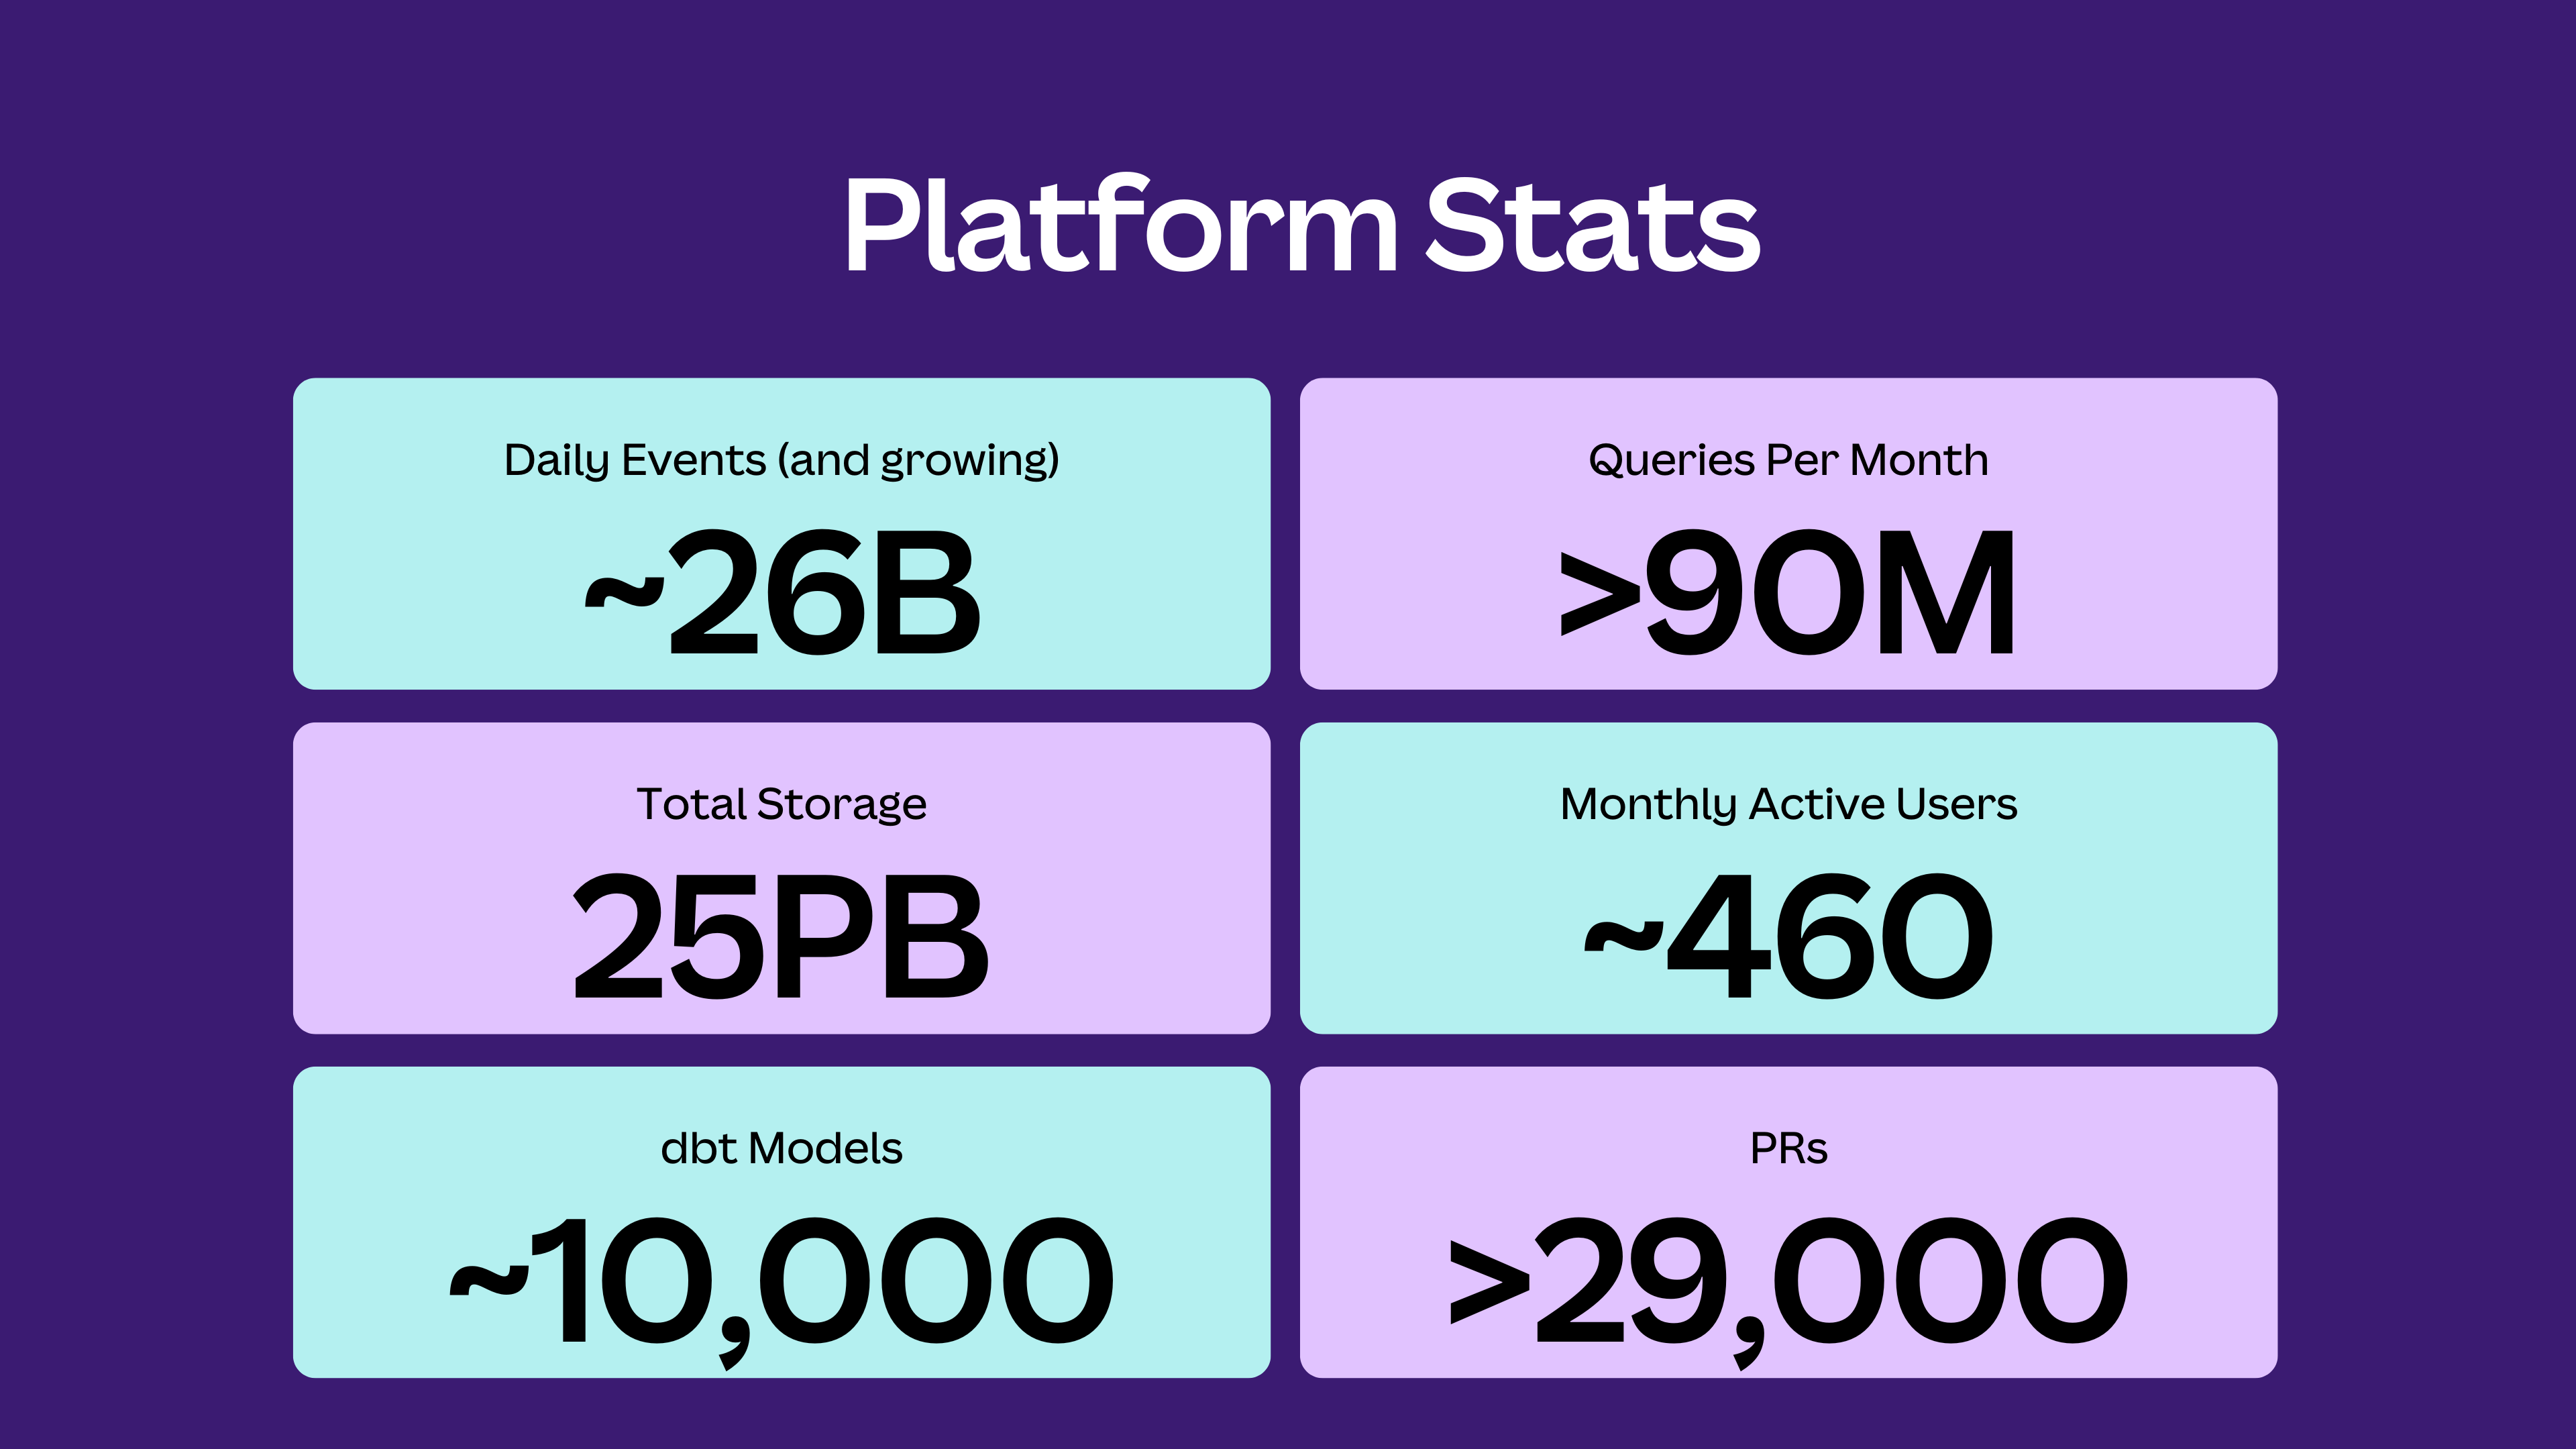
As we expand our data capabilities, Snowflake’s platform statistics are evolving alongside us. Our queries are becoming more sophisticated, our data volumes are growing, and the number of active users continues to climb. It’s exciting to see how Snowflake’s ongoing innovations shape our approach to data and analytics, empowering us to solve problems and uncover opportunities faster than ever.
The challenges
Over the years, it’s been hard to maintain a clear view of how we use Snowflake across Canva. With such a diverse range of platform users, including data analysts, backend engineers, and machine learning practitioners, it’s no surprise that keeping tabs on usage has been anything but straightforward.
The variety of ways teams leverage Snowflake only adds to the complexity. Some users interact directly with the platform through query tools, while others engage programmatically through JDBC or integrate it into workflows with dbt. Business Intelligence (BI) and analysis tools like Looker and Mode also pull data from Snowflake, further broadening the spectrum of usage scenarios. Each access method introduces unique characteristics, making it hard to consolidate and standardize visibility across the platform.
Adding to this mix are the different types of workloads that Snowflake supports. Whether transforming data with dbt, powering internal tools, or training machine learning models, each workload places distinct demands on the platform. These demands can vary in scale and how they use Snowflake’s resources, such as compute time and storage.

Unfortunately, when we started this journey in 2021, Snowflake didn’t provide an out-of-the-box solution that delivered full transparency into the platform. Visibility was fragmented, and piecing together a complete picture required combining insights from multiple sources, such as Snowflake account usage view(opens in a new tab or window), usage monitoring tools, and third-party integrations. This lack of a unified view made it difficult to manage costs, optimize performance, and understand how various teams use the platform’s capabilities.
Snowflake and dbt
To quote myself from July 2021:
Identifying true query performance would go beyond the duration and focusing on advanced stats captured, such as caching, spilling, load impact, bytes scanned, query pruning. In Snowflake, these statistics are located in the account_usage.query_history view. Currently, the only way to identify dbt model queries is to parse the query_text field in this view and identify a query comment generated at the top of each of our models...
Although Snowflake provides much of the metadata required to track platform usage, it has limitations, such as a 365-day moving window on the data available. To overcome this limitation, we embarked on a project to capture historical data across various ACCOUNT_USAGE views(opens in a new tab or window). This approach lets us perform year-over-year comparisons, particularly for compute and storage costs, which are critical for cost management and forecasting. Our solution includes a dbt project designed to capture this metadata incrementally, ensuring we can retain a historical record beyond Snowflake’s default window.
As well as Snowflake metadata, we also began capturing detailed dbt metadata for our main data transformation pipelines. For every dbt run, we store run results and manifest JSON files in S3, organized by target (dev, staging, and prod) and year, month, day, hour, and invocation ID. This structured approach to metadata management enables us to trace the execution history of our data transformations, which is invaluable for debugging, auditing, and optimizing our dbt workflows.
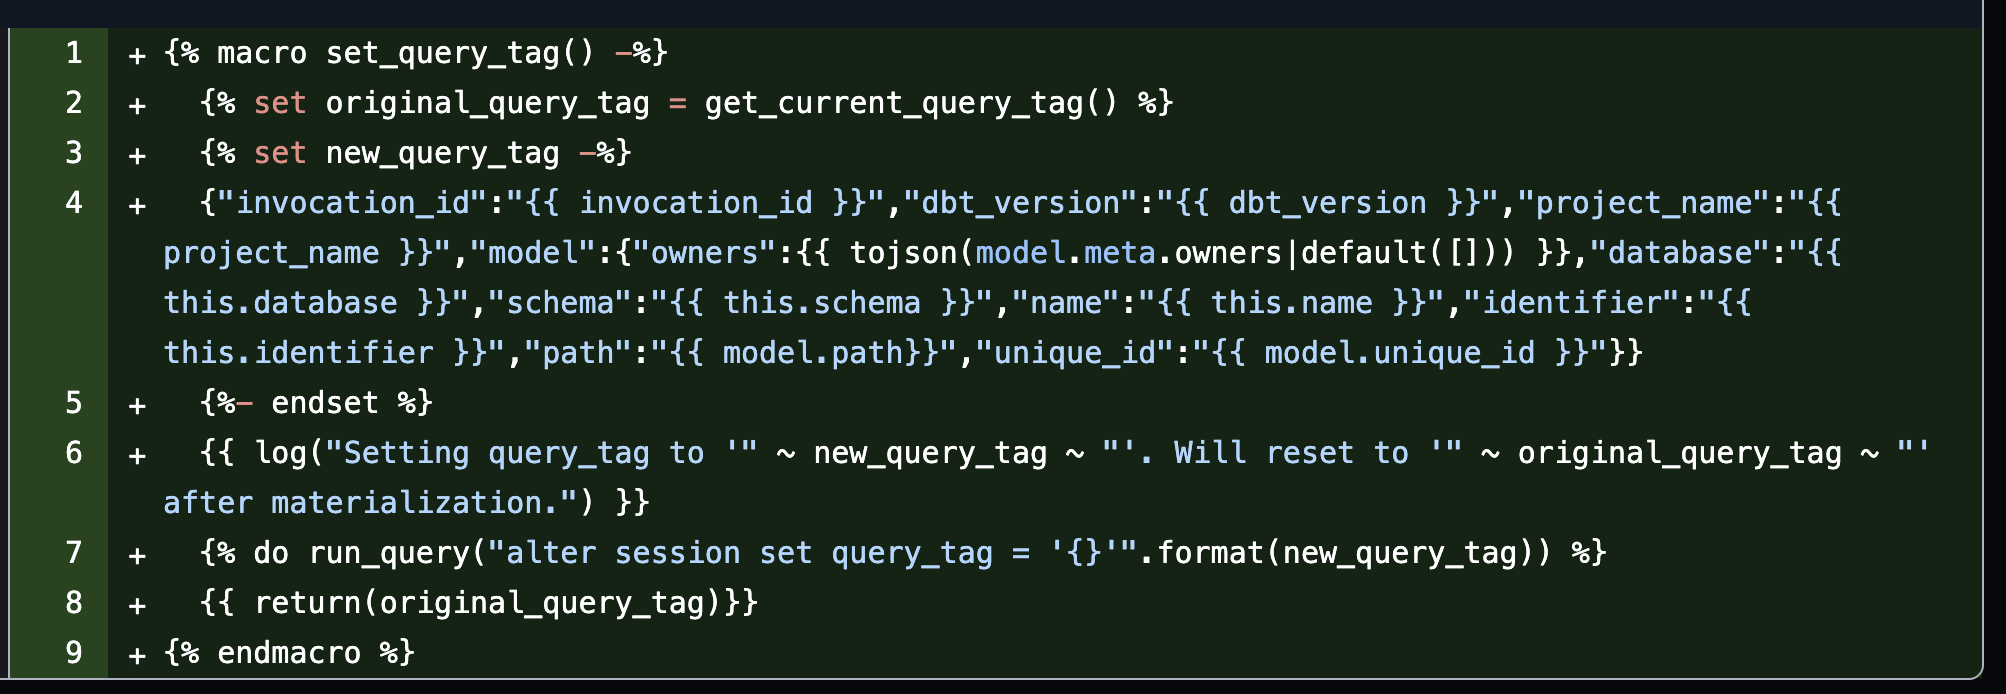
We developed a custom dbt query tagging macro to bring it all together. This macro added a query tag to each Snowflake query executed by dbt, containing metadata stored in JSON format. The query tag is then parsed using Snowflake’s built-in capability, allowing us to combine dbt metadata with queries found in Snowflake’s QUERY_HISTORY view. This linkage provides a comprehensive view of what transformations are happening, when, and why while also clearly mapping between our data models and the queries running in the background.
The initial version of this solution was up and running, providing us with an enhanced level of visibility into our data transformation processes and platform usage. One exciting aspect is that we had already been capturing model ownership within the dbt metadata, so we can now attribute specific transformations and costs to individual users. This capability not only helps in optimizing resource usage but also aligns data model stewardship with cost accountability.
With this, we laid the foundation for deeper analytics around platform usage trends, cost optimization, and data model performance. However, there was still plenty of room for enhancements.

Metadata modeling
To better use the captured dbt metadata, we leveraged our dbt project to parse the information into models and created summary tables that provide high-level insights into our dbt run results. These tables help track metrics such as the number of runs, success rates, and execution times, offering a clear overview of our data transformation workflows. This setup makes it easier for platform stakeholders to monitor the performance and reliability of their data pipelines at a glance.
Measure cost
We built attribution models to assign a cost to each query executed within Snowflake. Given the challenge of cost allocation at the lowest grain available for a Snowflake warehouse, which is hourly (regardless of cluster size), this was no small task. The complexity arises from multiple queries being executed within the same hour on a warehouse, making it difficult to accurately attribute costs based on time alone. Ian from Select.Dev does an excellent job explaining the challenges(opens in a new tab or window) of Snowflake cost attribution.
Given all the pieces we already had in place, this approach empowered us to analyze costs at a high level and attribute them to specific data models, teams, or even individual users. It helps identify cost-saving opportunities by pinpointing expensive queries, optimizing warehouse configurations, and refining transformation logic. These additional metrics allow for informed decisions around warehouse scaling, data pipeline scheduling, and prioritizing optimization efforts where they’ll have the greatest impact.
With our cost attribution models in place, we’re better positioned to drive accountability and encourage data teams to be mindful of resource consumption. This ongoing refinement of cost attribution aligns with our goal of building a cost-efficient, data-driven culture while still leveraging the full power of Snowflake’s capabilities.
Enable engineers
Now that we had much of the required data captured and modelled, the focus changed to surfacing this to our fellow Data Platform engineers. We rolled out reporting across Data Platform teams, providing dashboards to give them visibility into these key metrics. These dashboards covered essential aspects of our data operations, including:
-
Current Run: Detailed information about the status of the active dbt run, allowing for real-time monitoring.
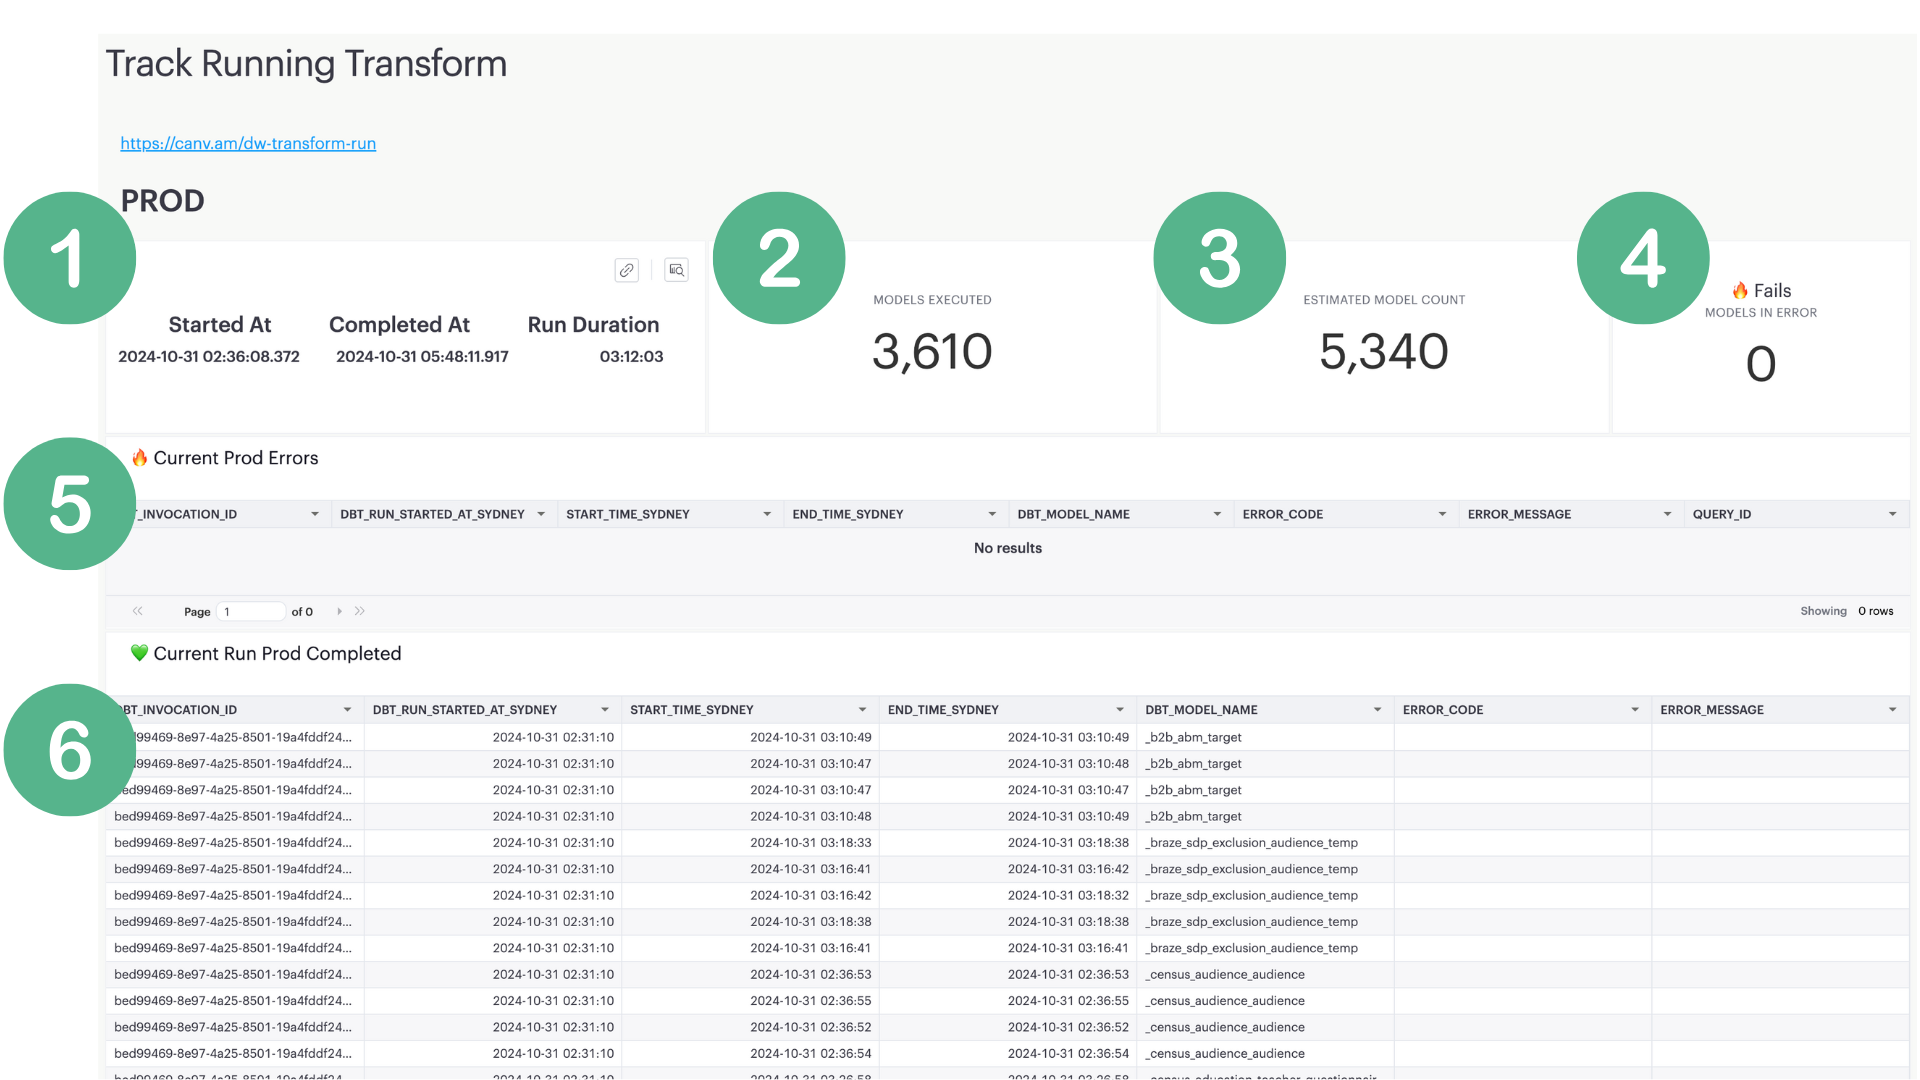 1. The start, end, and runtime stats. 2. Number of dbt models executed. 3. Total number of dbt models. 4. Failed model count. 5. List of models in error. 6. Models completed.
 -
Gantt View: A timeline-based visualization to track the execution order and duration of various models, helping teams optimize run times and identify bottlenecks. Models that block multiple threads are easily visible.
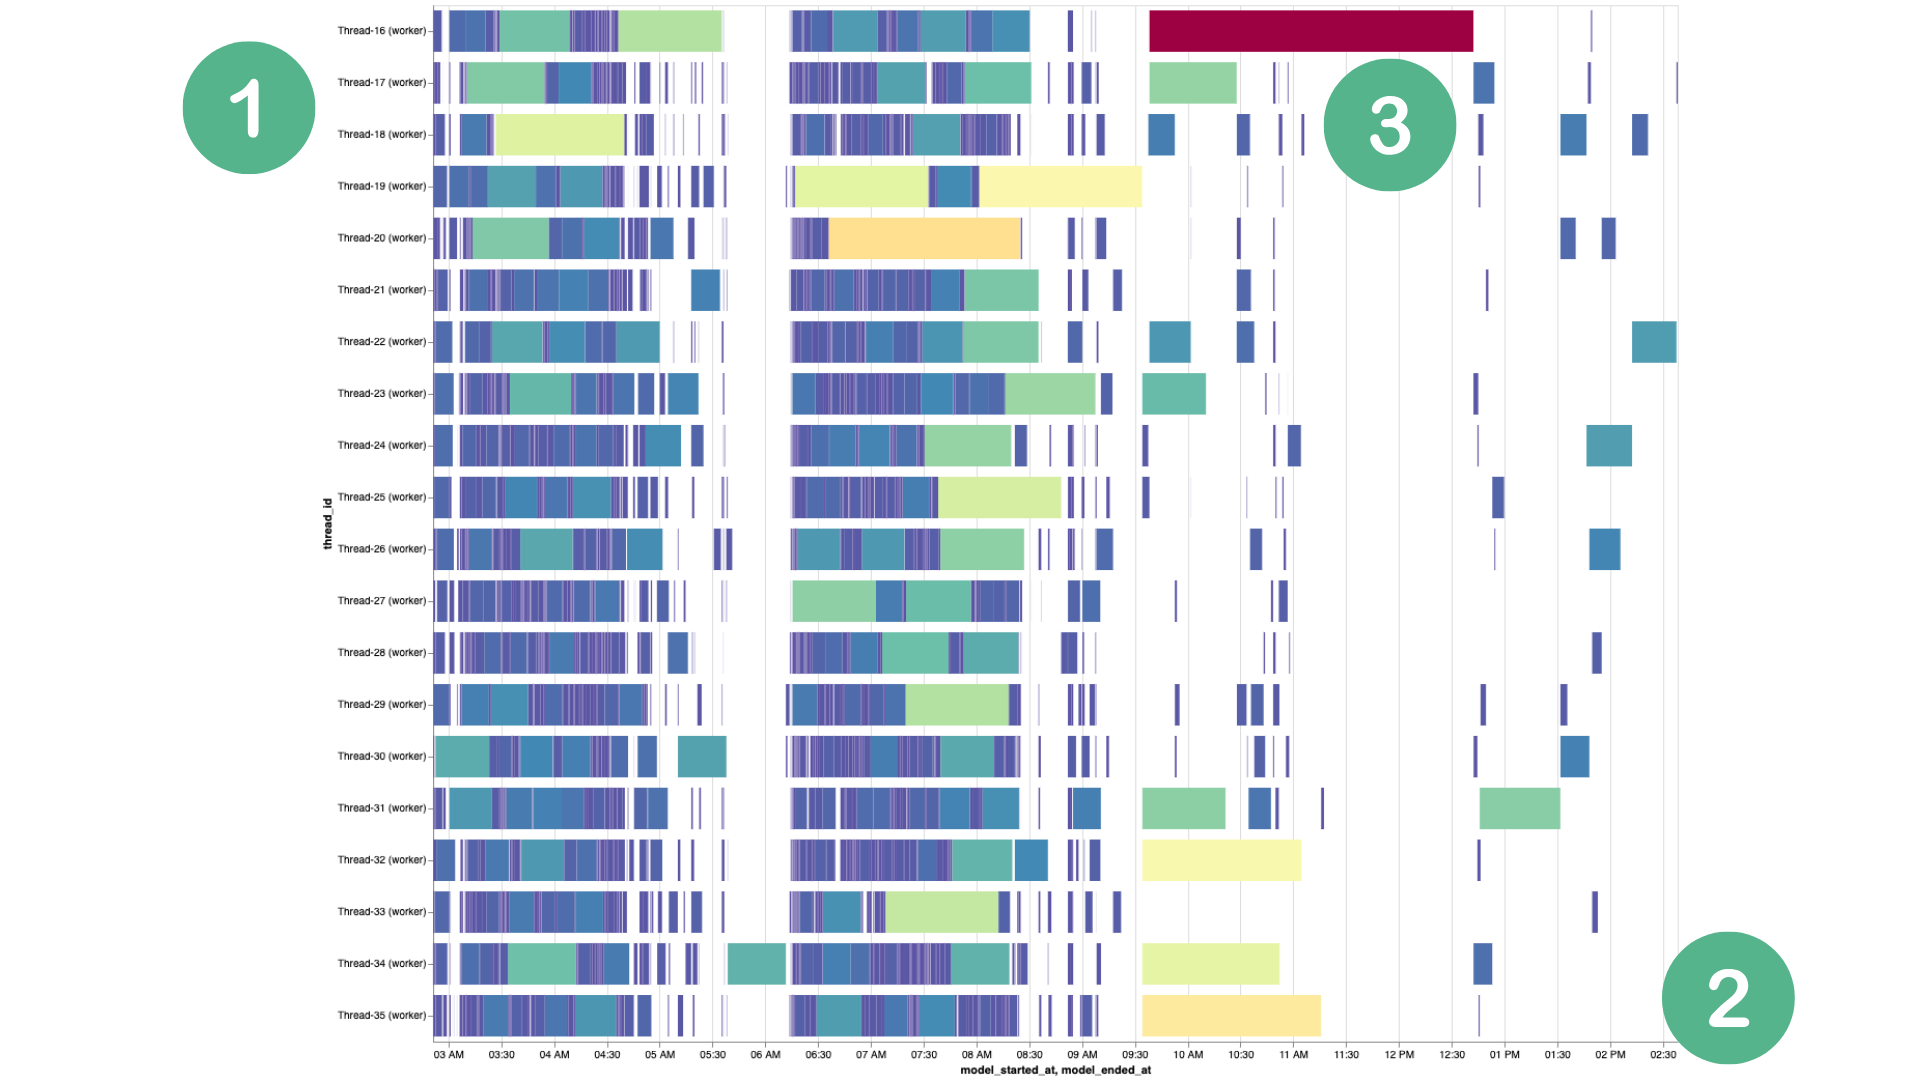 1. The dbt thread. 2. The local Sydney time the model ran. 3. Color coding model based on it’s run length. We also have a hover that shows more model details.
 -
Model View: A granular view of individual models, showing run history, success rates, compilation times, and cost attribution.
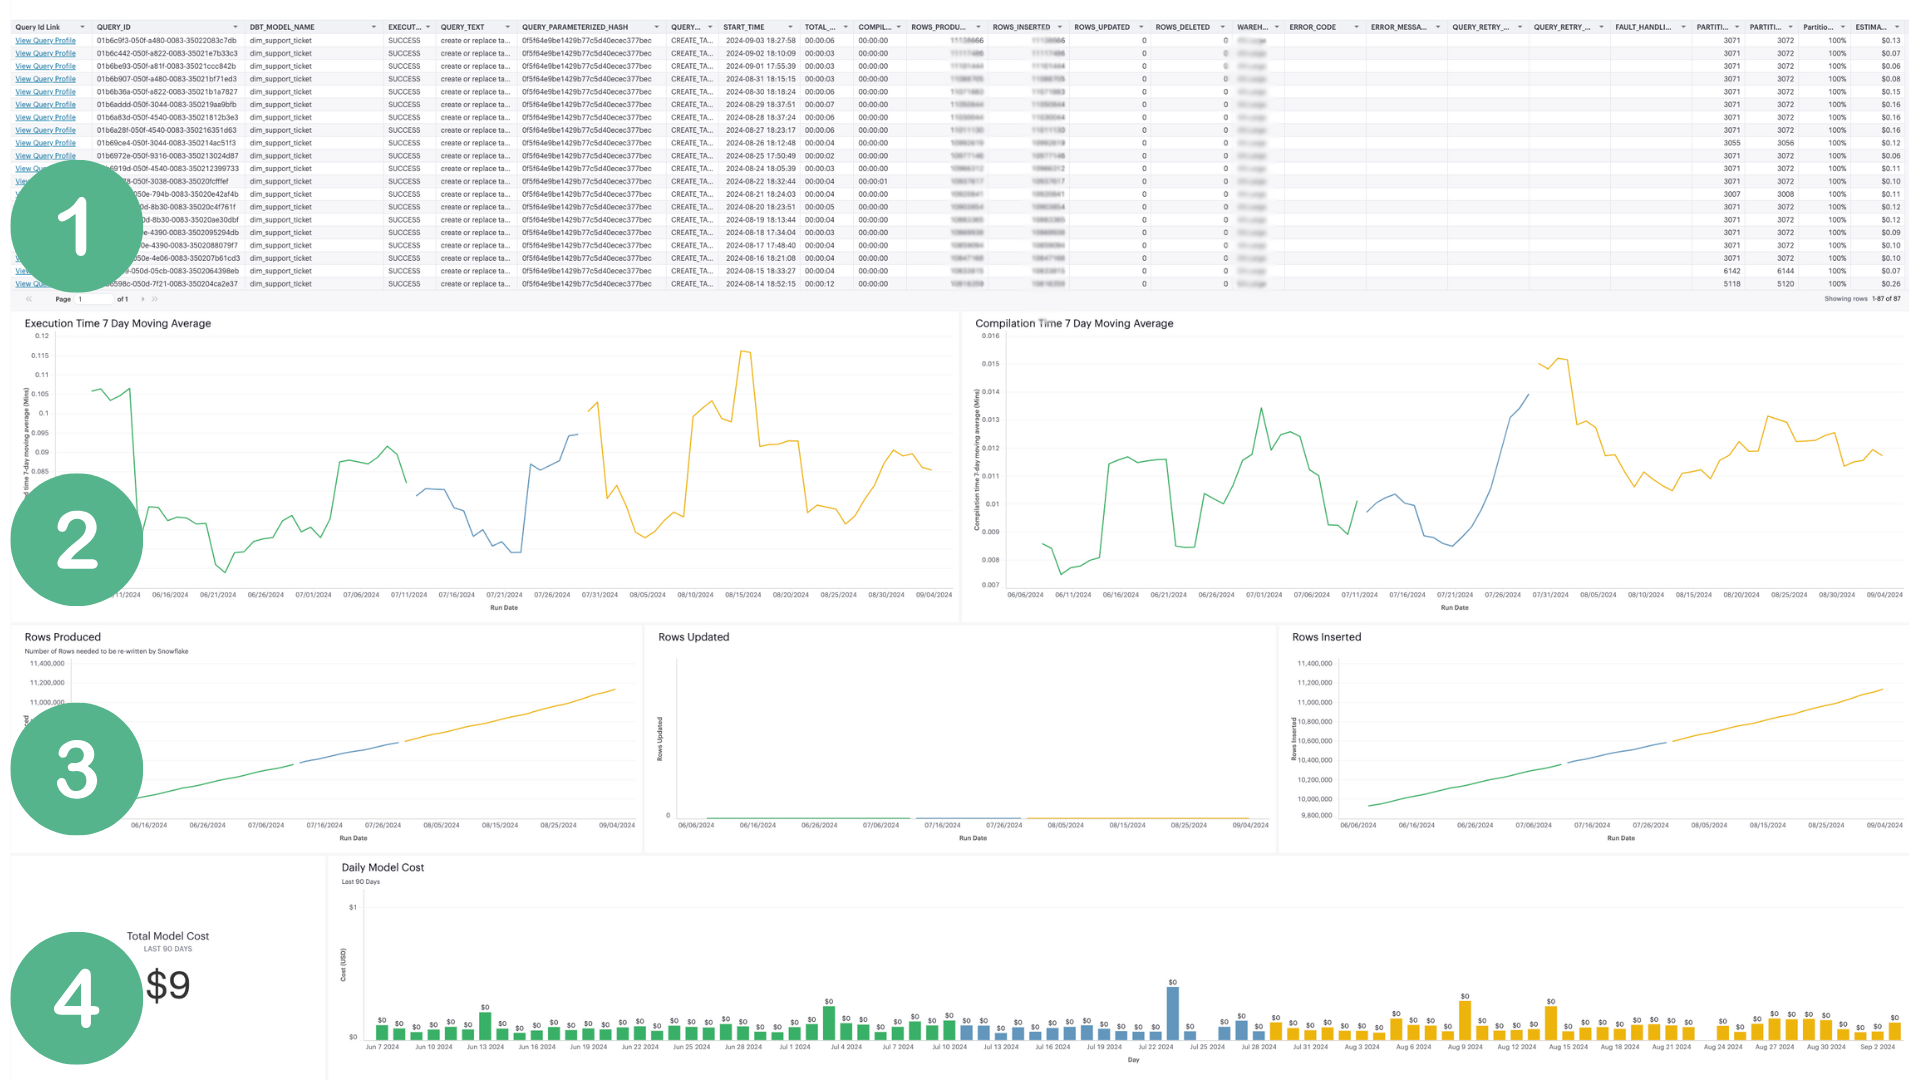 1. Model stats with a link to the Snowflake query ID. 2. Compilation and execution times. 3. Rows volumes over the past 90 days. 4. Aggregate and daily model costs. Color in this dashboard represents a model version based on the checksum making it easy to see the impact of a model change.
From here, we could extend the solution to the rest of Canva. The approach expanded beyond the primary data transformation pipeline to include all other dbt projects, ensuring a comprehensive view of our data landscape. We built an All dbt Projects Gantt view that consolidates metadata across different projects, allowing for cross-project analysis and a holistic view of the data transformation projects.
As we opened these datasets and insights to a broader audience, data engineers across teams began leveraging the data for their analysis. They could now build targeted reports and dashboards around their specific data assets, using the enriched metadata we captured to understand dependencies, optimize queries, and manage resource consumption more effectively.

To further streamline our solution, we shipped a change to dbt-snowflake(opens in a new tab or window) to set the query tag within the dbt namespace. This modification made it much easier for users to override the query tag as needed, offering more flexibility in managing query metadata.
We deploy bespoke dbt macros and materializations across all of the dbt projects at Canva through a common dbt package. To this we added a tagging capability to avoid the overhead of having to deploy and maintain the macro across multiple projects.
Extend to Looker, Mode, Census and internal tooling
We expanded our metadata capture efforts to include Looker and Mode, enabling us to tie queries to their owners and identify who executes them. This additional layer of metadata provides better visibility into how different teams and individuals use the platform, which helps us track resource consumption and promote accountability across Canva.
Internally, our experimentation analysis tooling uses dedicated compute resources, and many have adopted query tagging to facilitate ownership attribution. We can parse these tags embedded in the queries to identify the originating team or user, making it easier to track down the source of resource-intensive workloads.
For Looker and Mode, we use built-in query comments to capture metadata. These comments contain information about the originating dashboard, report, or user, and we parse this data to link the queries back to specific assets and their owners. This approach allows us to map queries to the responsible teams or individuals, regardless of whether the queries were run directly from a BI tool or through another interface.
By capturing this additional metadata, we significantly enhanced our ability to monitor usage patterns, attribute costs, and understand how different teams interact with Snowflake. It has also laid the groundwork for optimizing resource allocation, refining access controls, and providing tailored support for teams based on their usage profiles.
Map to the organizational structure
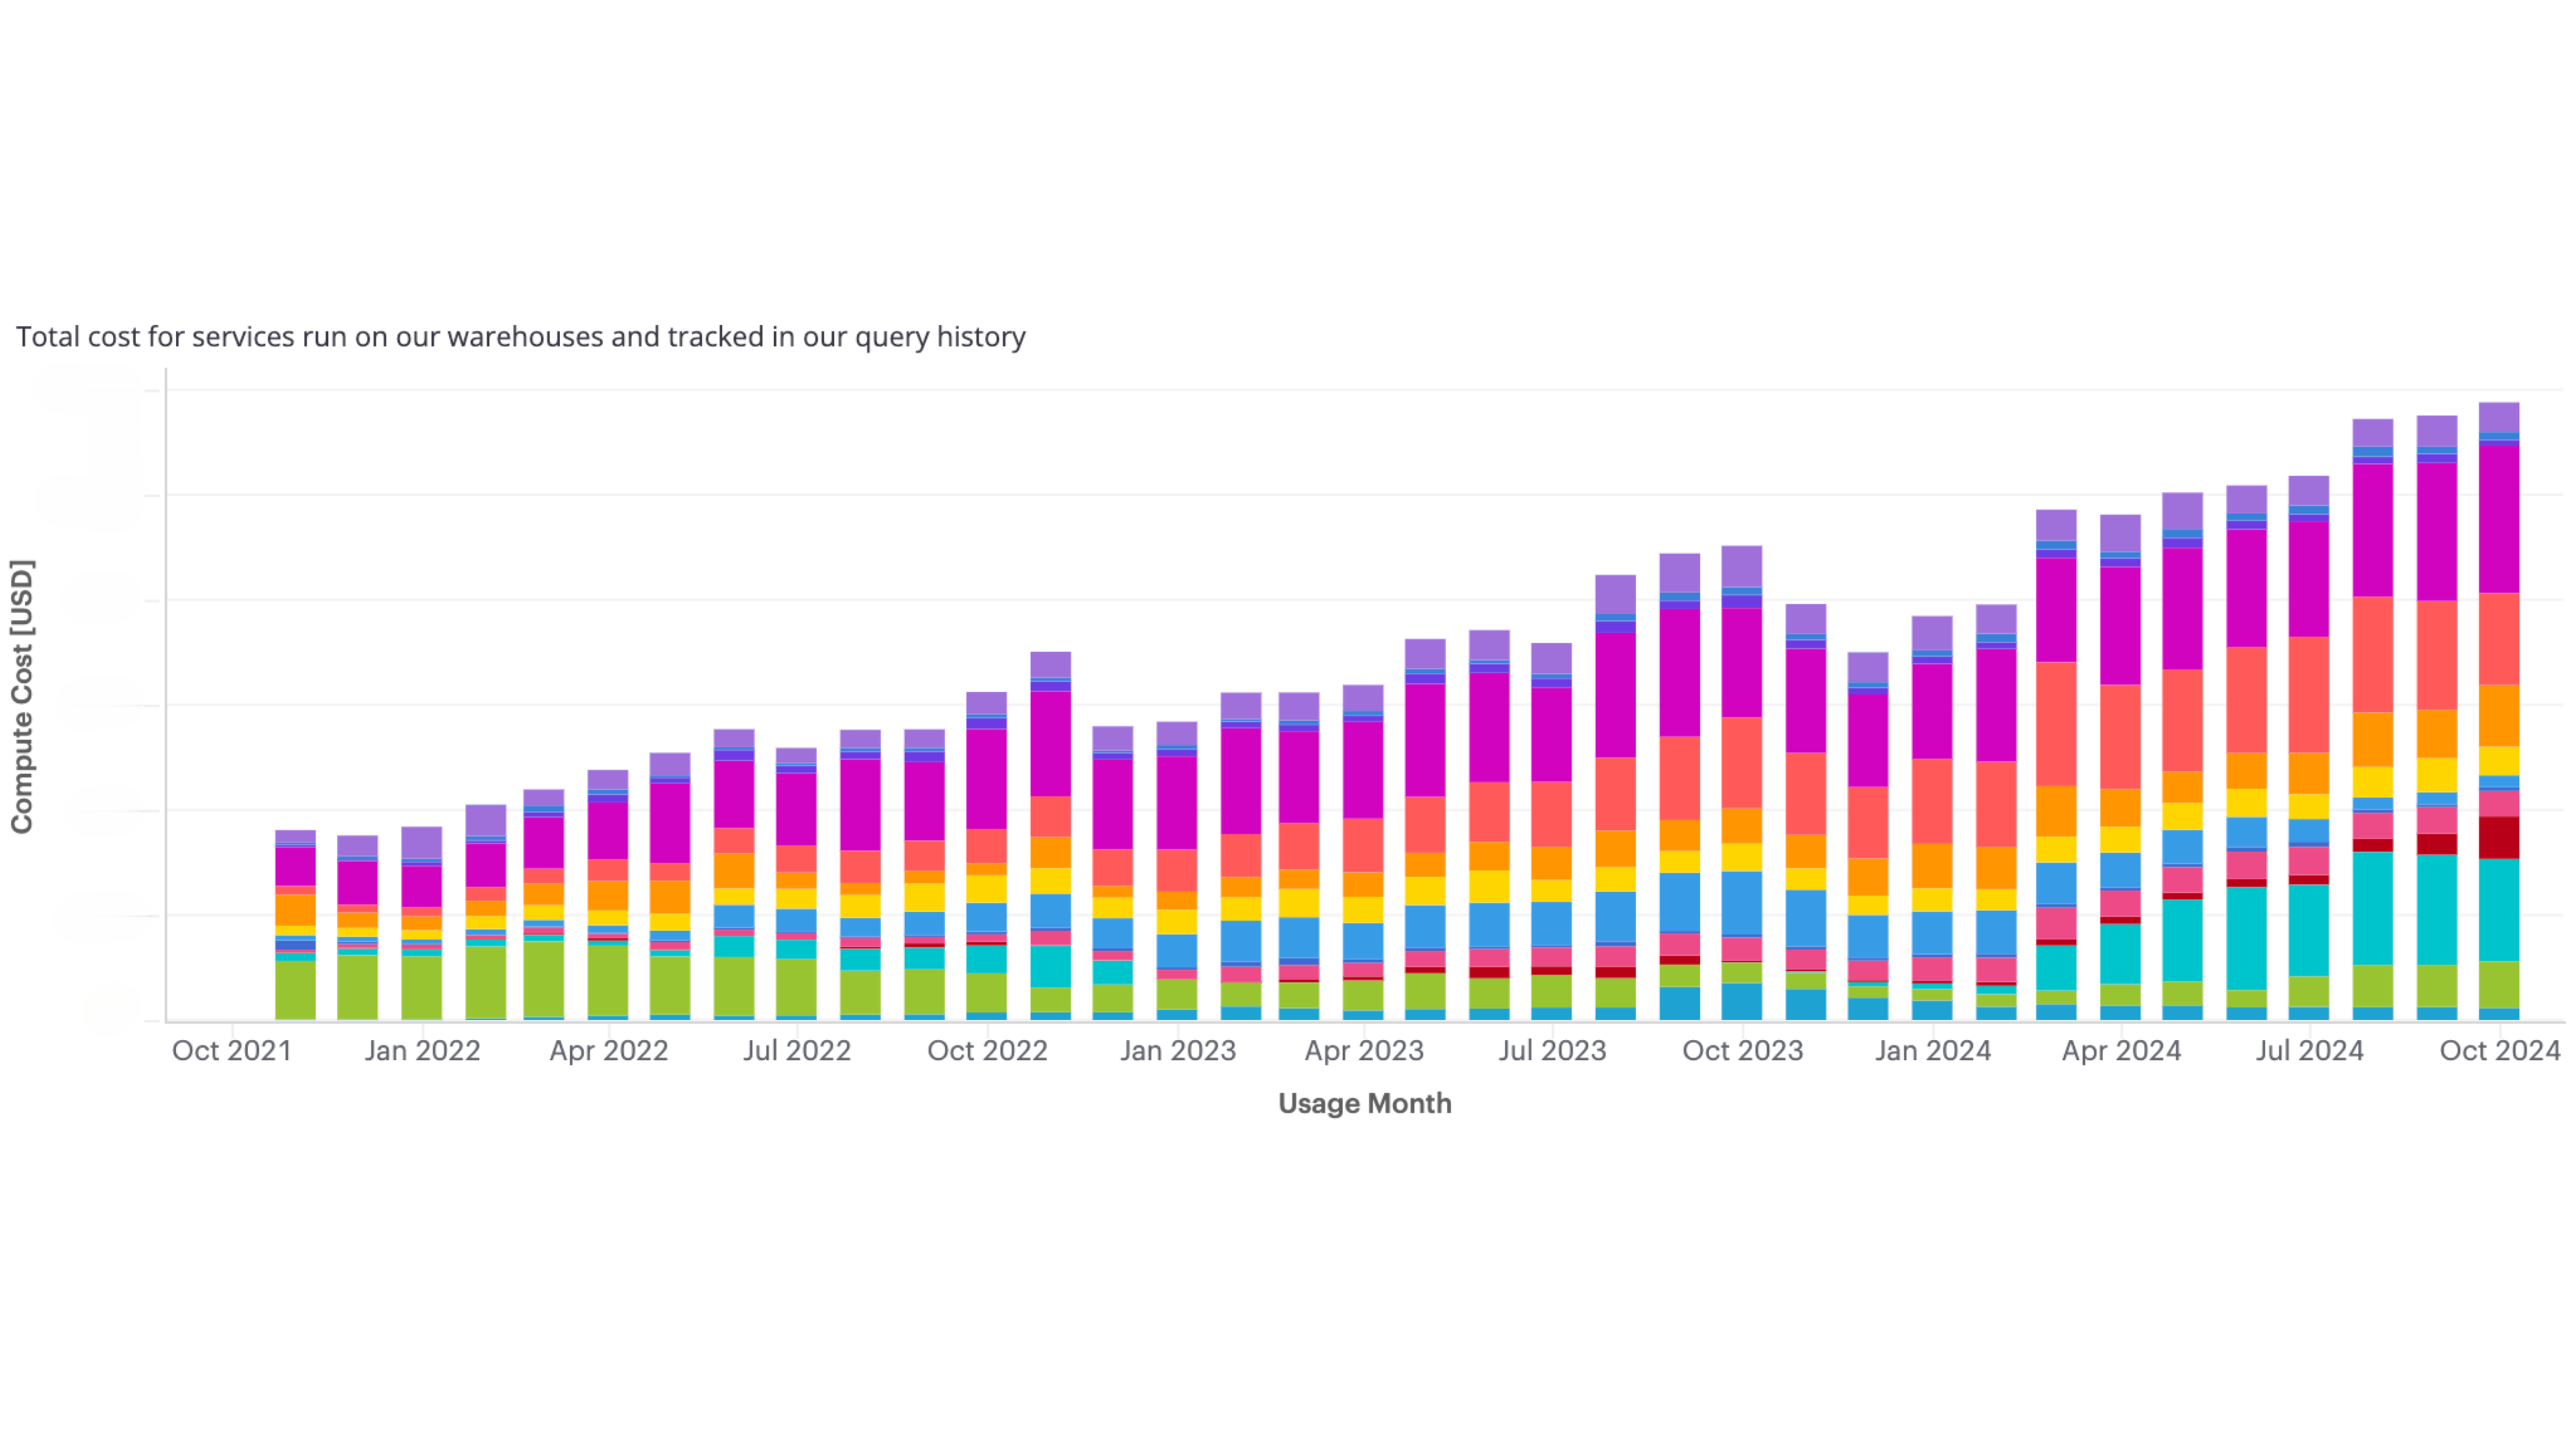
With the addition of Canva’s organizational structure datasets, we reached a significant milestone: the ability to map each query through our hierarchy and roll up metrics at the level of our organizational units. This integration allowed us to take our analysis to the next level by associating queries not just with individual users, but with their respective teams, departments, and larger organizational units.
2000 characters was never enough
Our team has grown increasingly fond of dbt, and as we delved deeper into leveraging its features, we began utilizing the meta property extensively. We added more metadata to our models, capturing crucial metadata for criticality, data classification, and data retention. This resulted in hitting the 2,000-character limit on query tags. Although this was evidence of our commitment to thorough documentation, it also highlighted the need for a more efficient solution to manage our metadata.
After reaching this limitation, we decided to move away from our DIY approach. We sought alternatives that would allow us to streamline our processes and enhance our capabilities. That’s when we discovered the game-changing dbt-snowflake-monitoring(opens in a new tab or window).
This package effectively addressed our needs and solved the 2,000-character query tag limit by automating the monitoring of Snowflake usage and performance metrics. It offered comprehensive features that let us do all the things we were already doing, without the overhead of maintaining our custom solution. With dbt-snowflake-monitoring, we could gain insights into our data transformation processes, empowering our teams to easily make data-driven decisions.
One of the advantages was that we already had a relatively complete Snowflake account usage history. This historical data meant we could reprocess all our previous runs with the new monitoring models and metrics integrated into dbt-snowflake-monitoring. By reprocessing our history, we could continue to make multi-year comparisons of our data, and weren’t starting from scratch.
Snowflake catches up, somewhat
Recent updates to Snowflake have introduced new features that significantly enhance visibility into platform usage right out of the box. One of the standout additions is the Cost Management feature, which offers insights into compute usage and highlights the most expensive queries at an account level. This capability allows organizations to quickly identify high-cost operations and monitor overall resource consumption, providing a valuable snapshot of financial metrics.
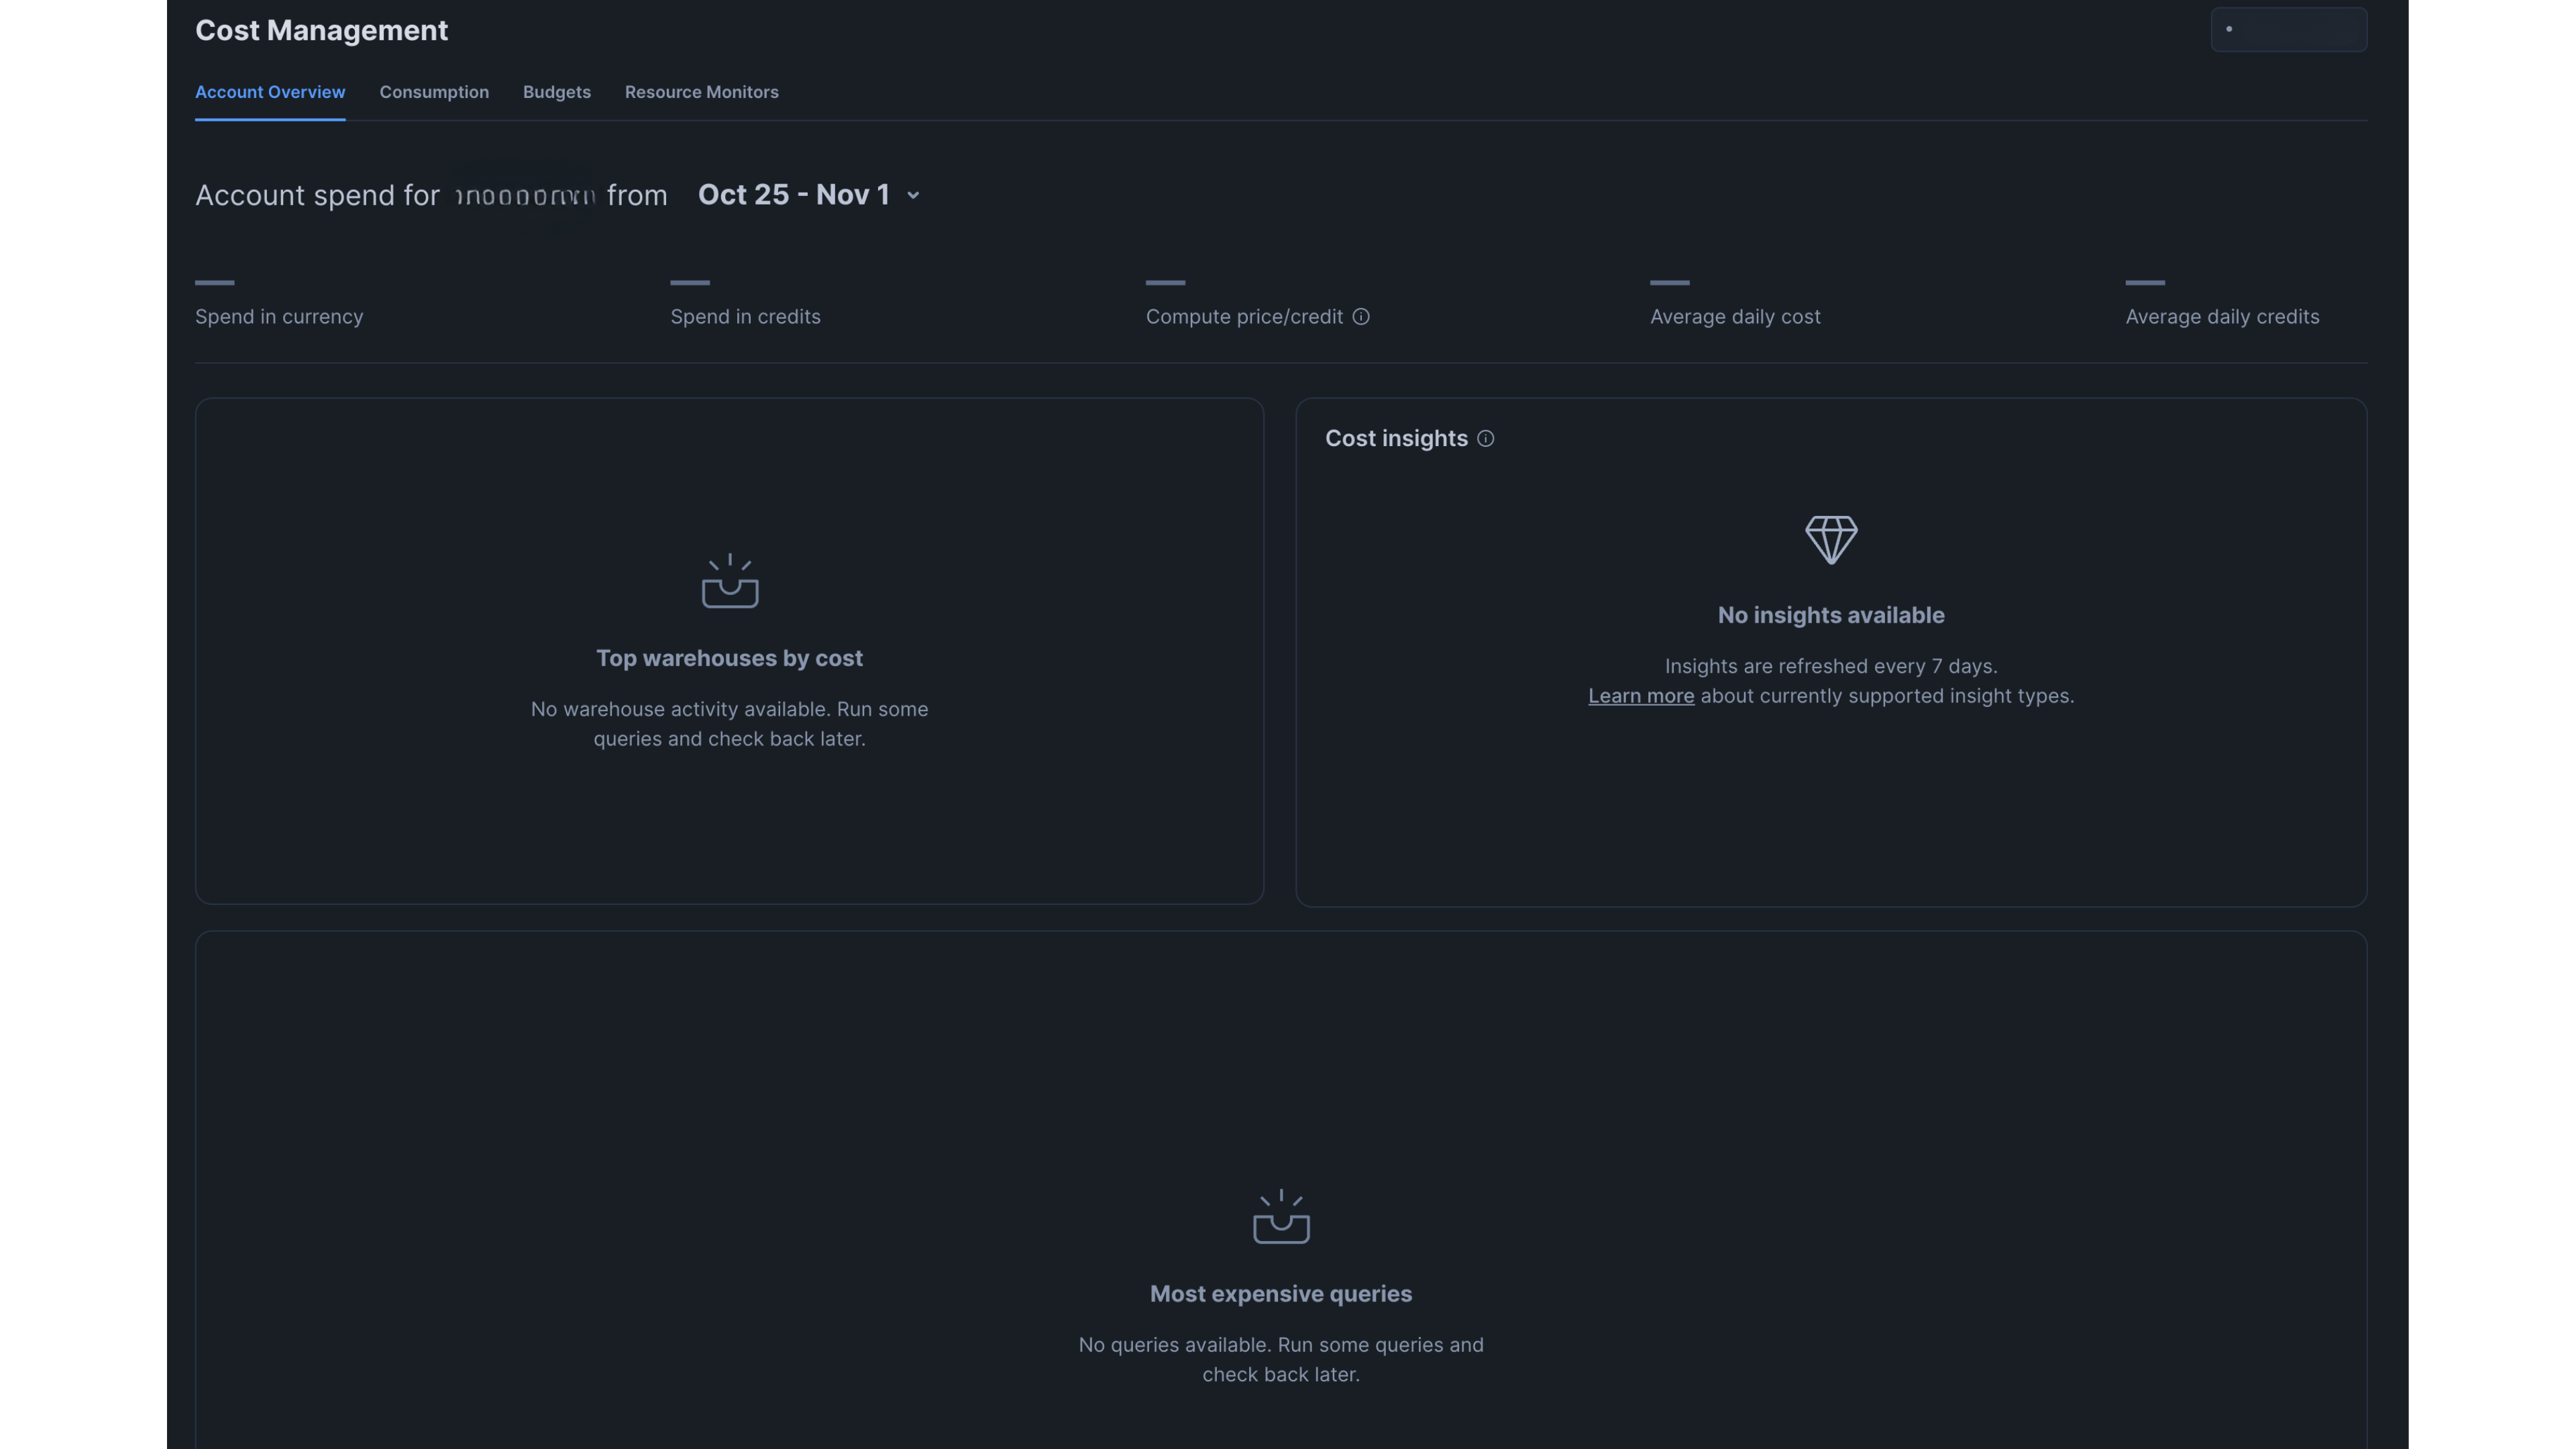
Although this feature is a step in the right direction, it doesn’t provide the granularity we need for our analysis. Our goal is to attribute costs more precisely according to our organizational structure. To effectively manage our resources and budgets, we require insights beyond the account level and drill down into how individual teams, groups, and supergroups consume resources.
Impact
Over the past 3 years, we’ve learned a lot from building our own data management approach. The operational and cost visibility enhancements have had a profound impact on how we manage our data operations in Snowflake.
Operational visibility
We’ve experienced the following operational visibility improvements:
- Improved monitoring of workloads: With this visibility, we can closely monitor various workloads running on Snowflake. This lets us identify patterns in query performance, execution times, dbt success rates, and resource utilization, enabling proactive platform management.
- Enhanced troubleshooting: With detailed insights into query execution, teams can quickly pinpoint issues affecting performance. This streamlined troubleshooting process improves the overall reliability of our data pipelines.
- Greater accountability: By mapping queries to our organizational structure, we can hold teams accountable for their resource usage. This transparency fosters a culture of responsibility, encouraging teams to optimize their queries and workflows.
- Data-driven decision making: With enhanced operational visibility, teams have access to the data they need to make informed decisions. This empowers them to optimize workflows, prioritize tasks, and allocate resources more effectively.
Cost visibility
We’ve experienced the following cost visibility improvements:
- Comprehensive cost tracking: Our cost management visibility provides a high-level overview of compute usage and expenses. This capability helps identify which queries are driving costs and enables teams to take action to optimize their usage.
- Accurate cost attribution: By integrating insights from Snowflake with our detailed metadata, we can attribute costs to specific teams or projects. This granularity helps us understand which areas of Canva are incurring the highest expenses and allows for targeted cost management strategies.
- Budget management and forecasting: With better visibility into cost trends, we can manage budgets more effectively. This data-driven approach to forecasting lets us allocate resources where they’re needed most and anticipate future spending based on usage patterns.
- Optimization opportunities: Identifying the most expensive queries gives us the opportunity to analyze and optimize those processes. By refining inefficient queries or adjusting warehouse configurations, we can reduce costs while maintaining performance.
Overall, the advancements in operational and cost visibility are transforming how we manage our Snowflake environment. By leveraging these insights, we can enhance accountability, make more informed decisions, and drive efficiencies across our platform. This increased visibility is paving the way for a more optimized, cost-effective, and data-driven culture within Canva.
What we learned
We now have an extensive understanding of the internal workings of Snowflake and dbt, with a particular fondness for the importance of metadata in general. Our familiarity with Snowflake’s account and organizational usage views(opens in a new tab or window) has become deeply ingrained.
Enabling teams to have visibility and transparency into both the performance and cost of their workloads is beneficial for everyone involved. It fosters a culture of accountability and encourages teams to proactively manage their resource consumption.
The necessity for this level of visibility is scale-dependent. If your Snowflake instance is relatively small, you might find that Snowflake’s built-in cost management offerings suffice for your needs. This functionality is continually evolving and provides visibility for many users. However, at our scale, pursuing a more tailored approach has proven worthwhile. It has highlighted numerous opportunities for optimization and resource deprecation, justifying the effort we invested in building our own solution, especially since comprehensive solutions were scarce until recently.
Mapping costs to specific dollar figures has also been invaluable in discussing the value of running particular workloads. When stakeholders see the actual costs compared to the perceived value generated, the decision to discontinue less efficient processes is much more straightforward.
That said, there are still gaps in the Snowflake query metadata that we wish we had access to. While it continues to improve, we recognize that 99% of Snowflake users may not be as concerned with the level of detail we’ve pursued; your needs might vary.
If we were starting fresh today
If we were to start anew, we would undoubtedly integrate dbt-snowflake-monitoring(opens in a new tab or window) right from the beginning. Kudos to the team at Select.Dev(opens in a new tab or window) for creating this package. It handles the heavy lifting of monitoring and reporting, generating the metadata models we need. Although we’ve extended some of its capabilities to meet our specific requirements, it provides everything one would need out of the box.
Given the advancements in the landscape, we would likely consider leveraging a pre-built solution to streamline our processes, as several viable options are now available. Back in 2021 when we began this journey, such solutions were limited, which drove us to develop our own.
Finally, I can’t emphasize enough the importance of metadata. Even tracking high-level metrics can be incredibly valuable. Just keeping an eye on your storage and compute costs in a dashboard can provide crucial insights that support better resource management.
Next Steps
This is how we currently manage our visibility of Snowflake workloads. It’s been quite the journey, but there’s still plenty of work to do, such as extending it to all of our Snowflake accounts, increased coverage for new Snowflake functionality, automated performance, and cost alerting.
If you’re just starting this journey or well down the path, we hope you can take something away from our experience. Reach out if you’re keen to chat all things Snowflake!
Acknowledgements
Thanks to Anna Bisset(opens in a new tab or window) for her work implementing and migrating to dbt-snowflake-monitoring and to Kieran O’Reilly(opens in a new tab or window), Jaskirat Grover(opens in a new tab or window), Paul Tune(opens in a new tab or window) and Grant Noble(opens in a new tab or window) for reviewing this article.


