Computer vision
How we see groups in design
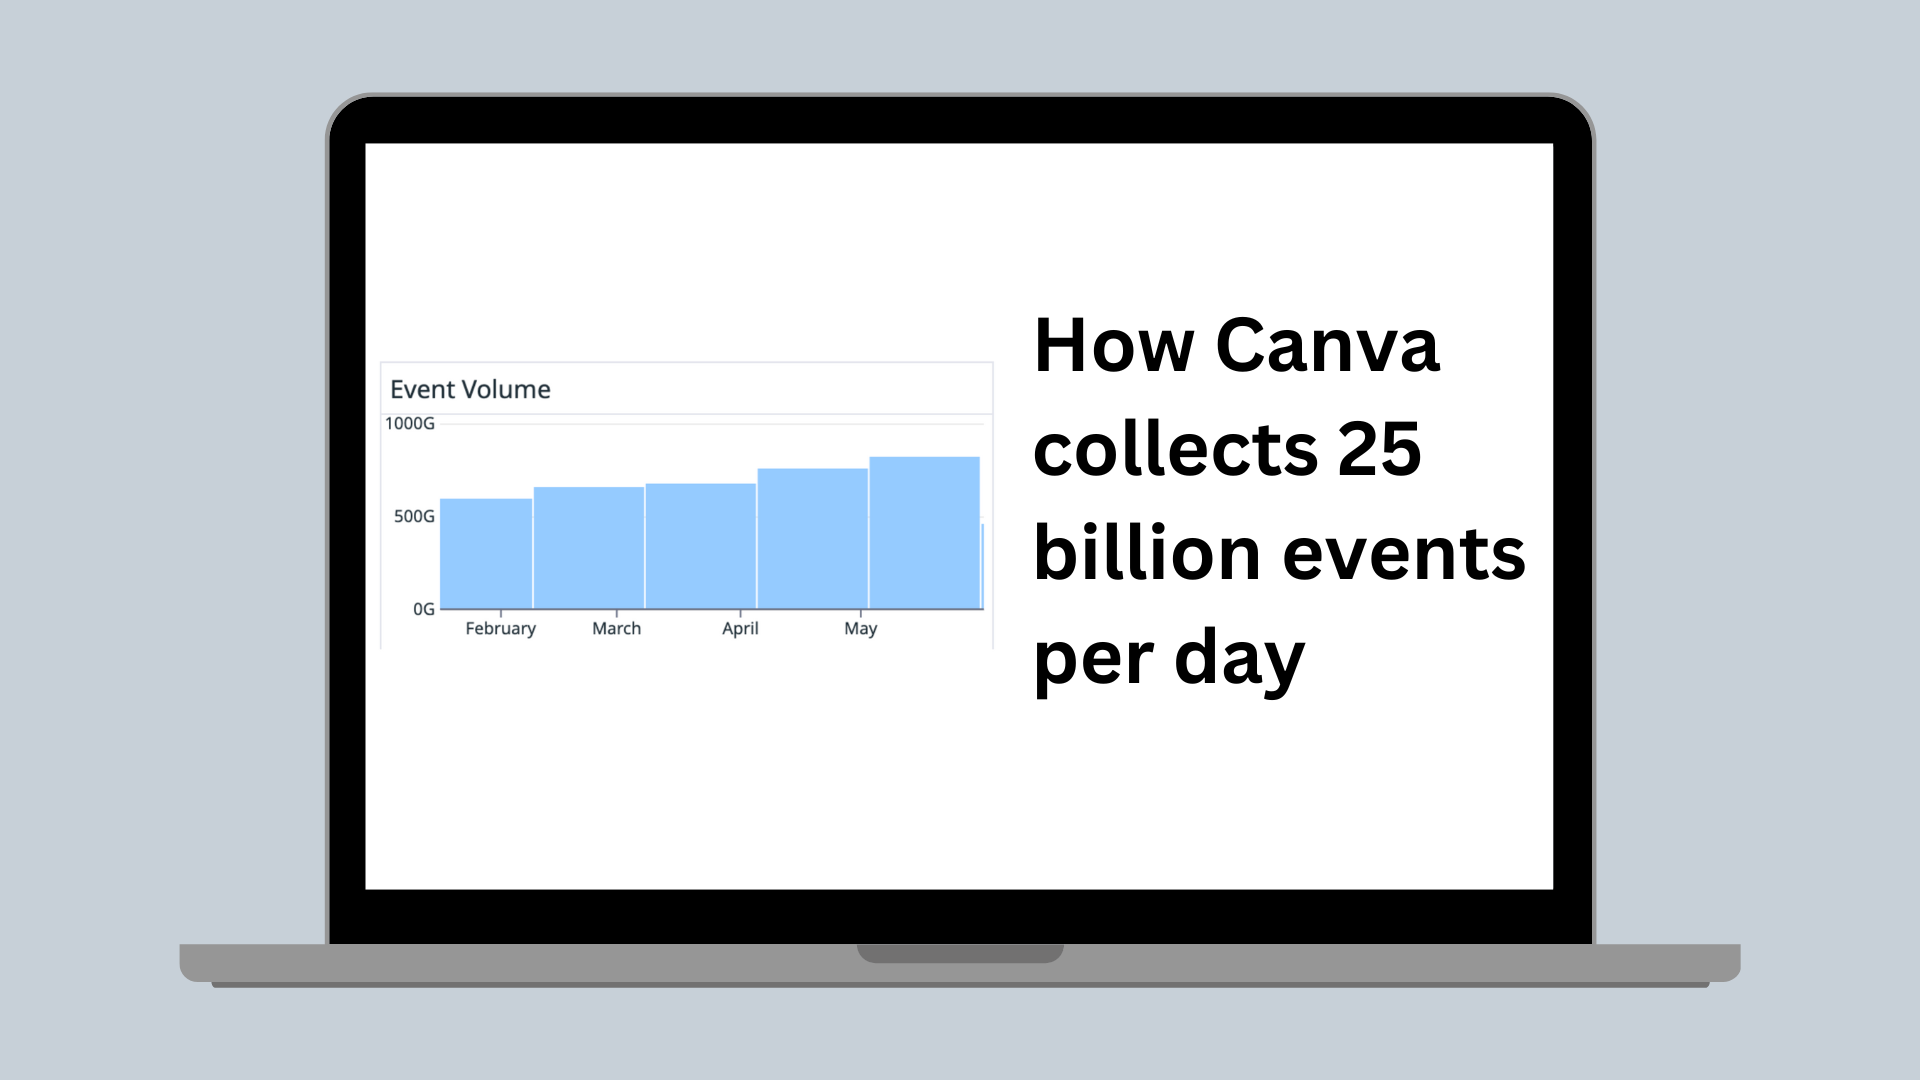
How we understand and detect groups in user designs
Canva seeks to empower users to transform their designs in a way that inspires and accelerates their work. But to do this while keeping our editing experience simple, we need to develop design-understanding technology that decodes how the elements on a page come together to create meaning and beauty.
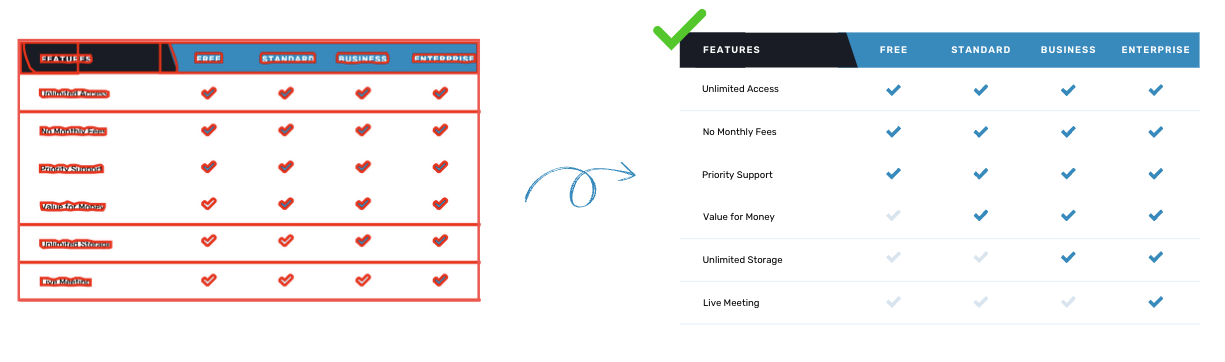
Users have multiple options for constructing components in a design. For instance, to add a table, users can select a predefined table element from Canva’s Element library, or create a custom table using lines and shapes to reflect their style and creativity. This flexibility extends to other components like charts, diagrams, and graphs.
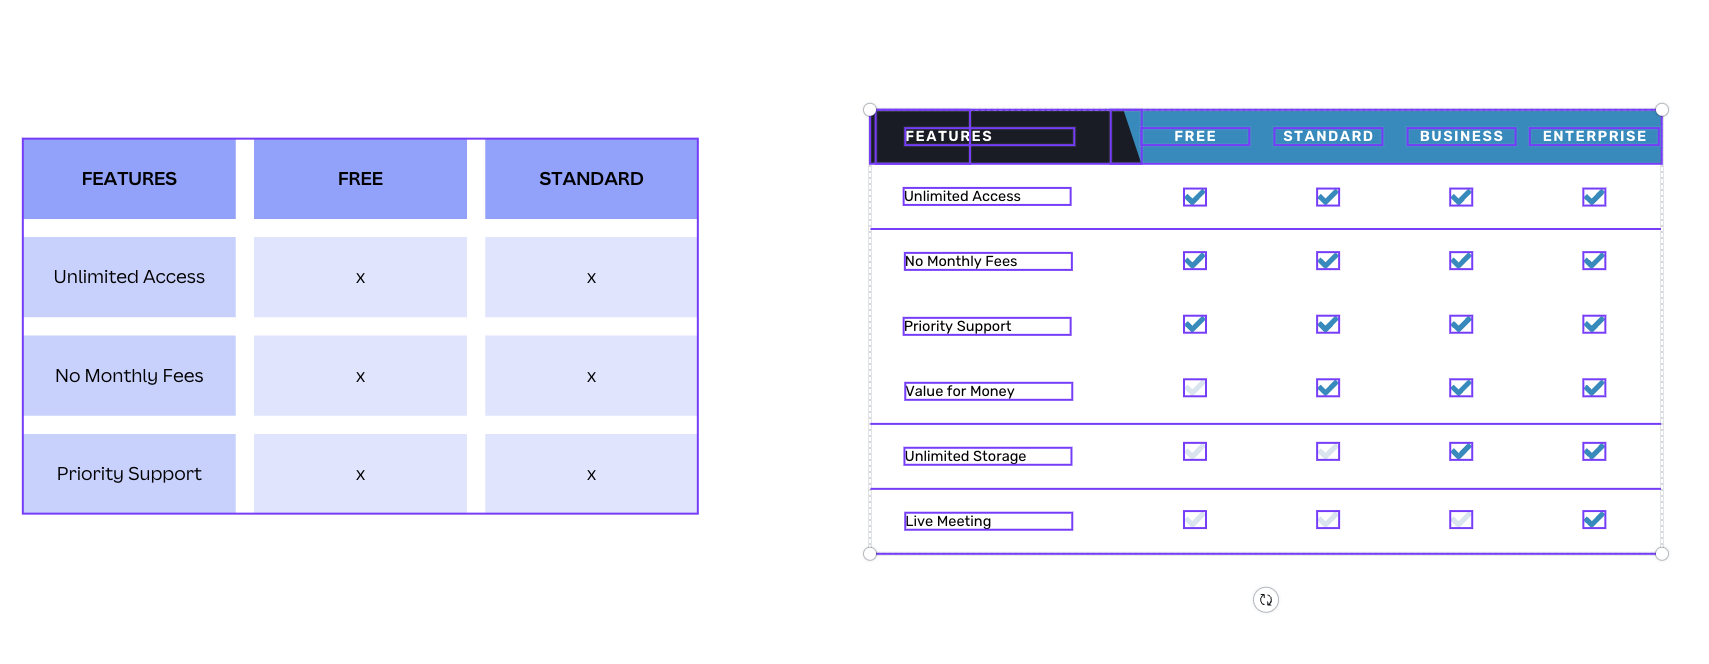
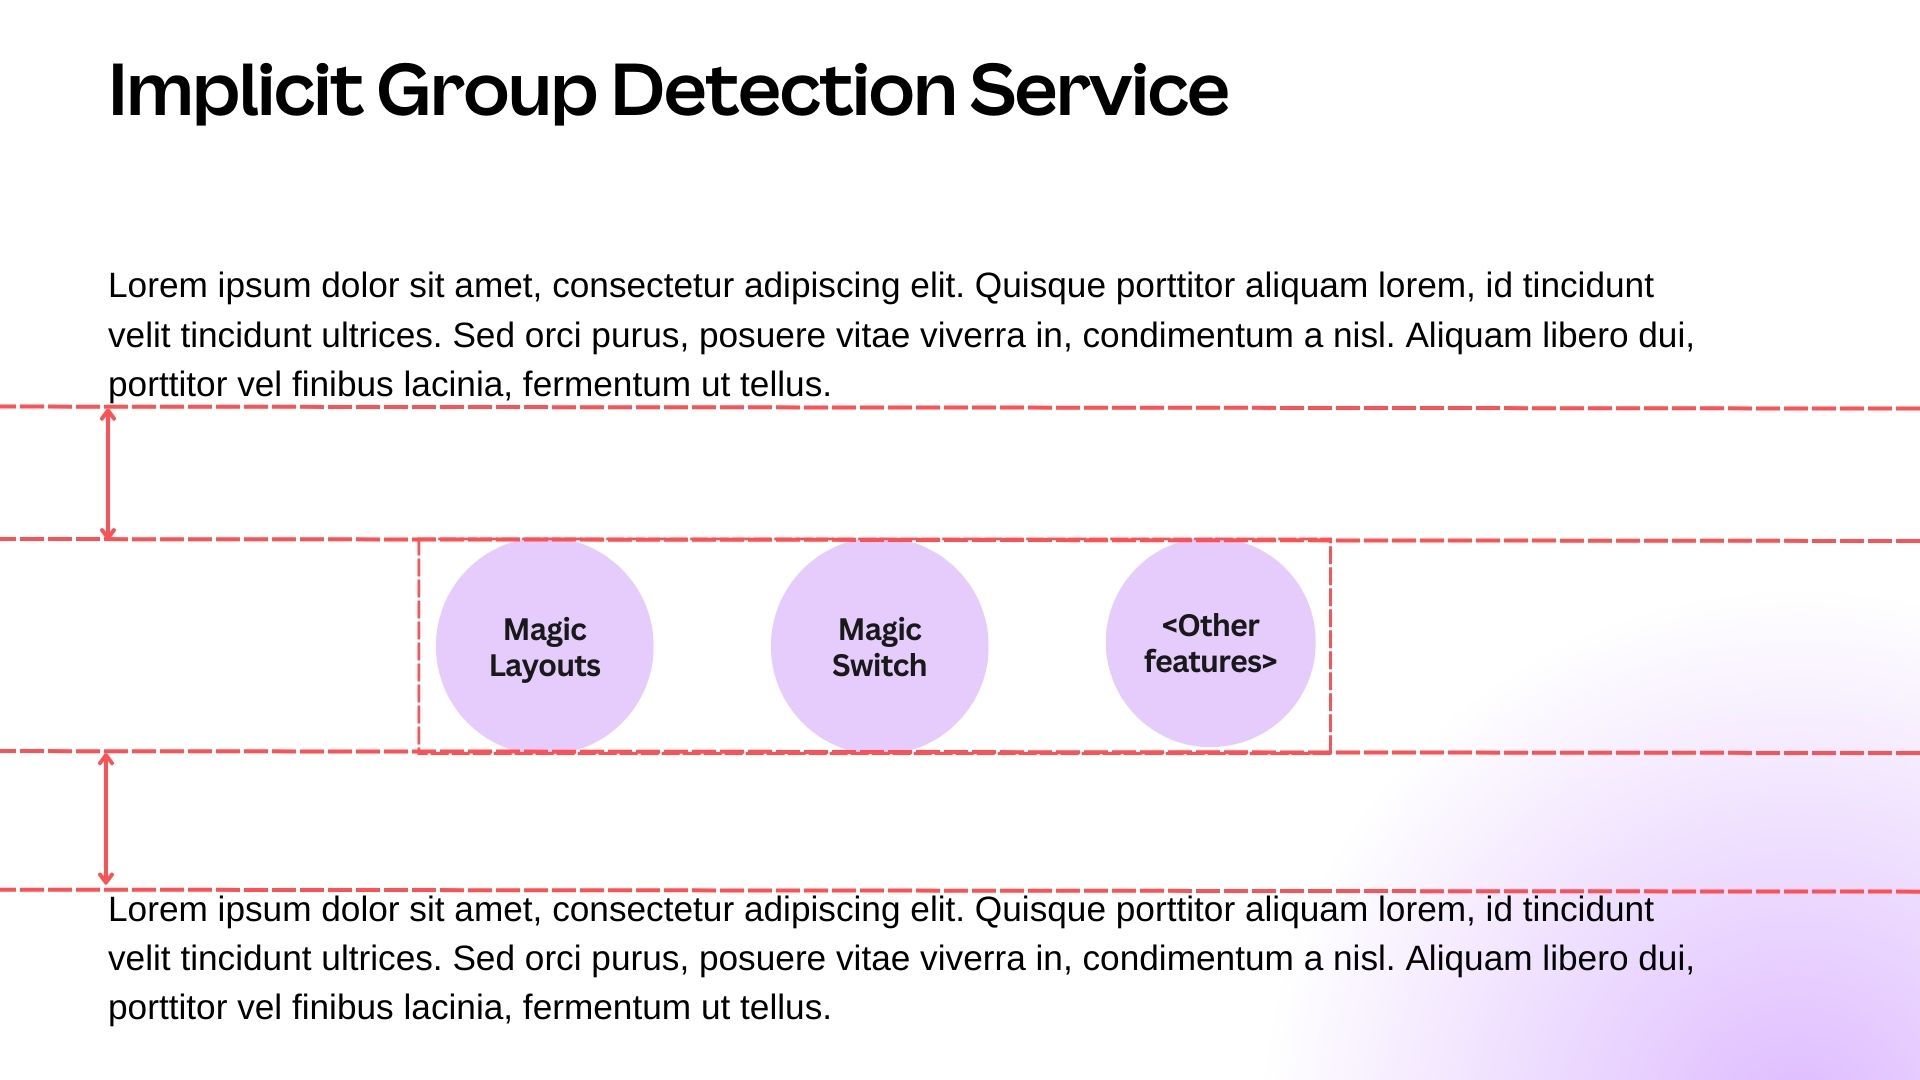
It's critical to consider this in Canva features that manipulate the design. In a feature like Magic Layouts(opens in a new tab or window) or Magic Switch(opens in a new tab or window), we don't want to treat a table as a dissociated collection of shapes and text. It's essential to ensure these elements remain cohesive during design transformations. We aim to treat a table like a table and a chart like a chart, no matter how they’re built.
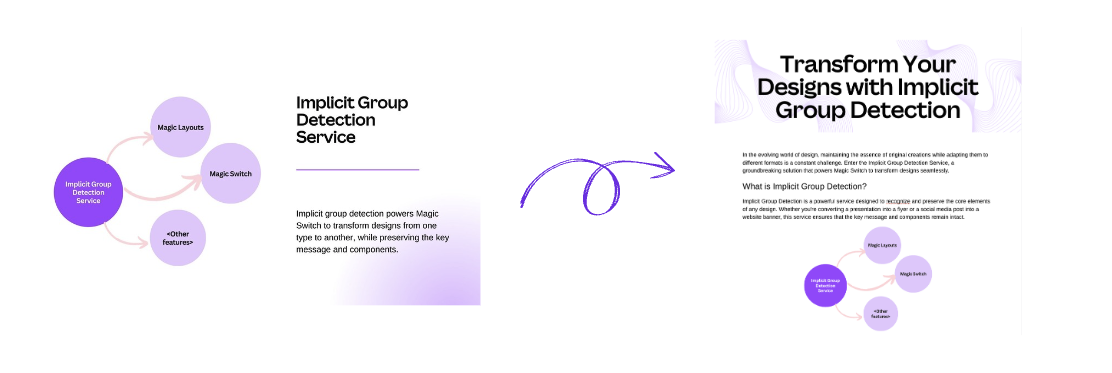
Magic Layouts inspire users with beautiful layout alternatives to their current design, while preserving the design content and its meaning.
Magic Switch transforms designs from one type to another, preserving the key message and components.
Implicit groups
Each design comprises various elements, which individually might hold little meaning or information. However, the combination of these elements creates the overall semantics of the design. Going back to the previous table example, individual lines or shapes might not immediately suggest a table, but collectively, they form the design component that is clearly perceived as a table.
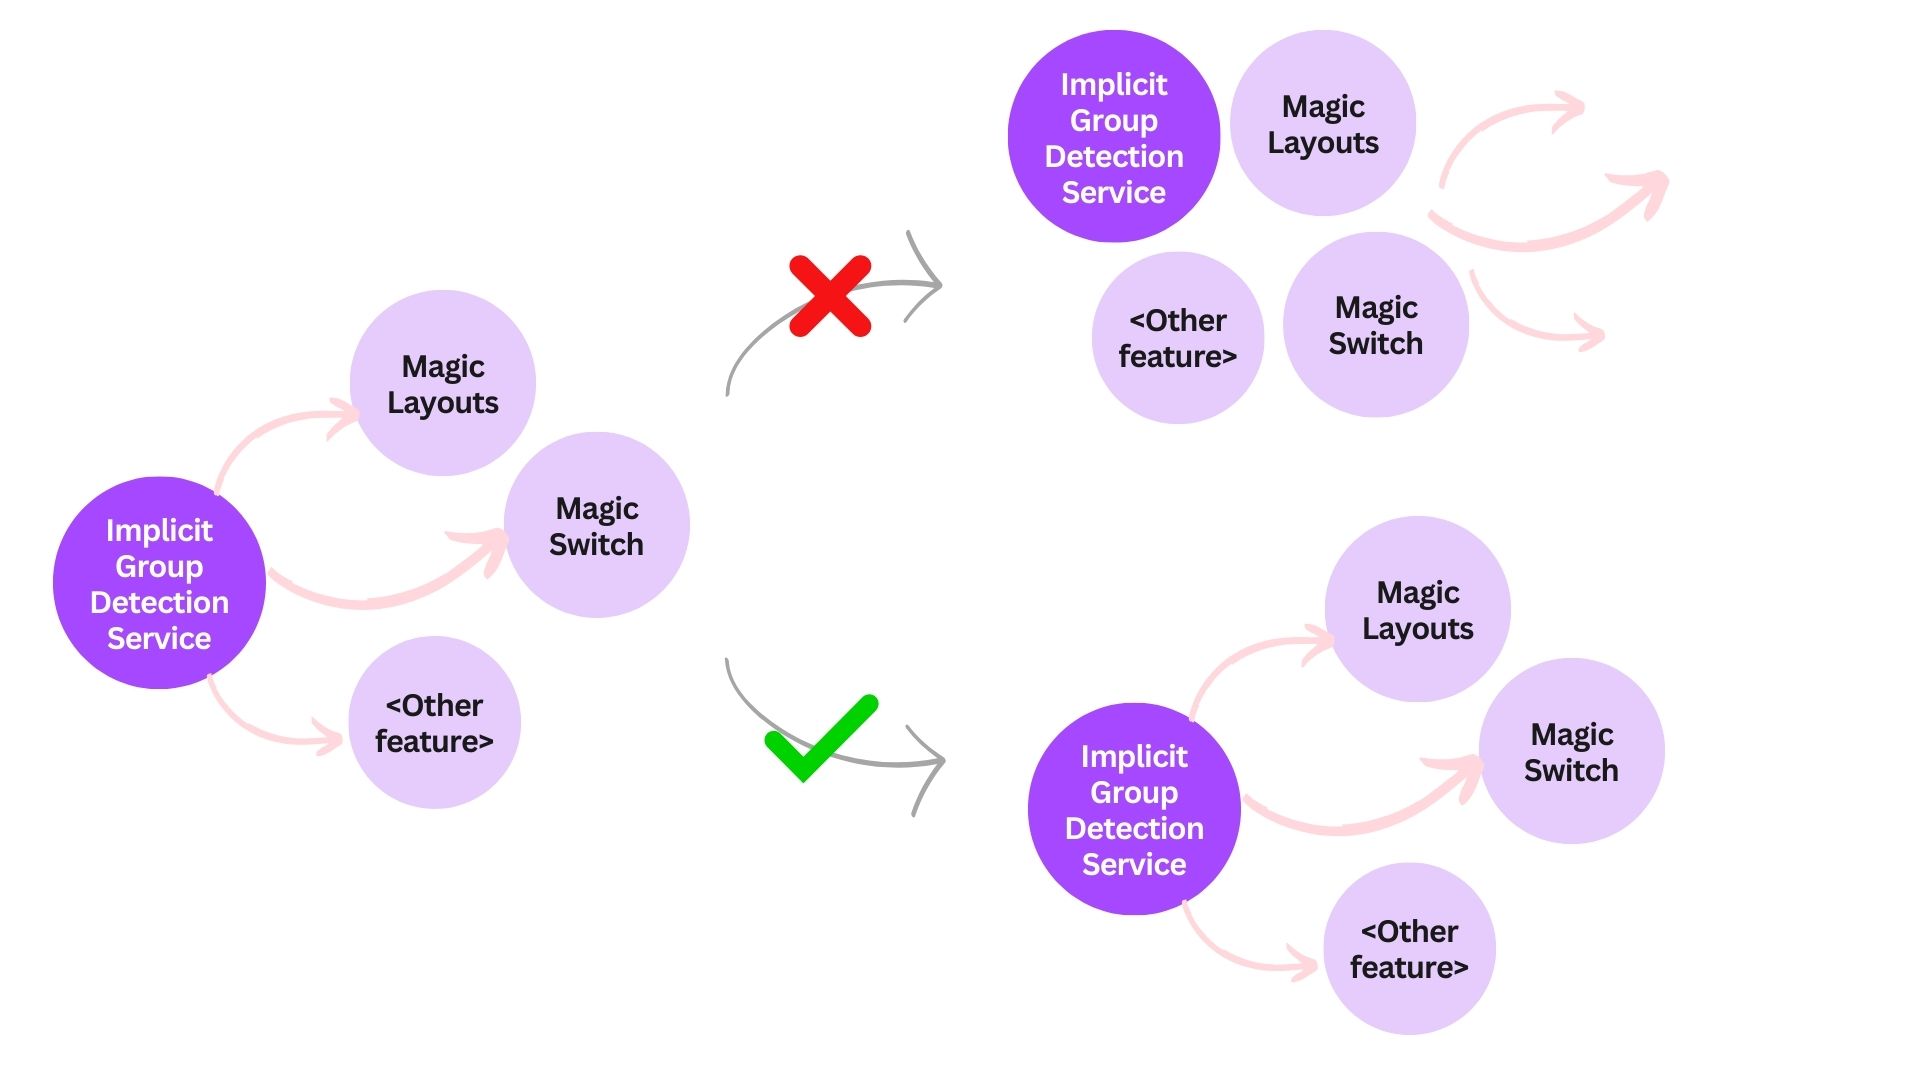
We call these elements that are not explicitly grouped by users implicit groups. We’re particularly interested in implicit groups where the configuration of elements must remain unchanged to retain their semantic meaning, or the immutable implicit groups. Our goal is to identify and implicitly group these elements to preserve their semantic meaning after a transformation.
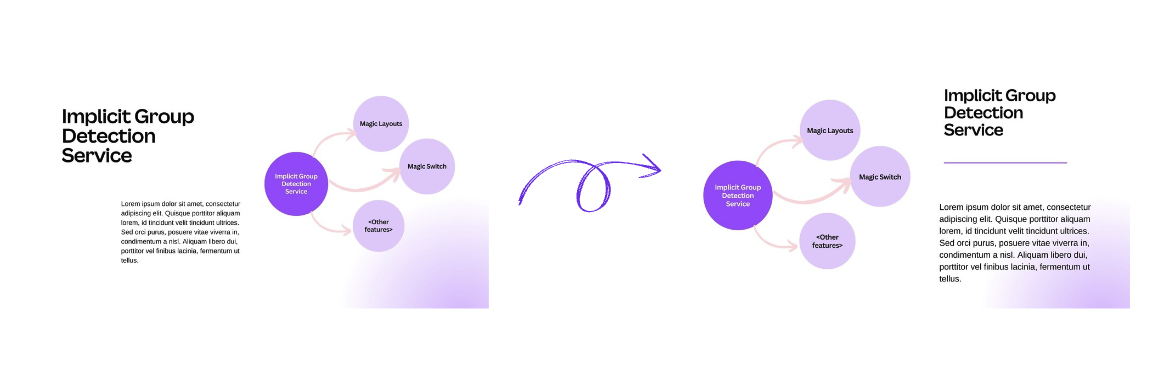
A result we want to avoid is, for example, one that treats a diagram as several scattered arrow and circle elements (see the following diagram). This means we can’t treat a whole diagram as the sum of its parts.
So, how might we identify these groups during our design understanding journey? One approach is top-down, treating the entire page as a single group and recursively dividing it into subgroups. Alternatively, we can identify groups by analyzing the intrinsic attributes of the elements and their visual semantics.
Separate elements using white space only?
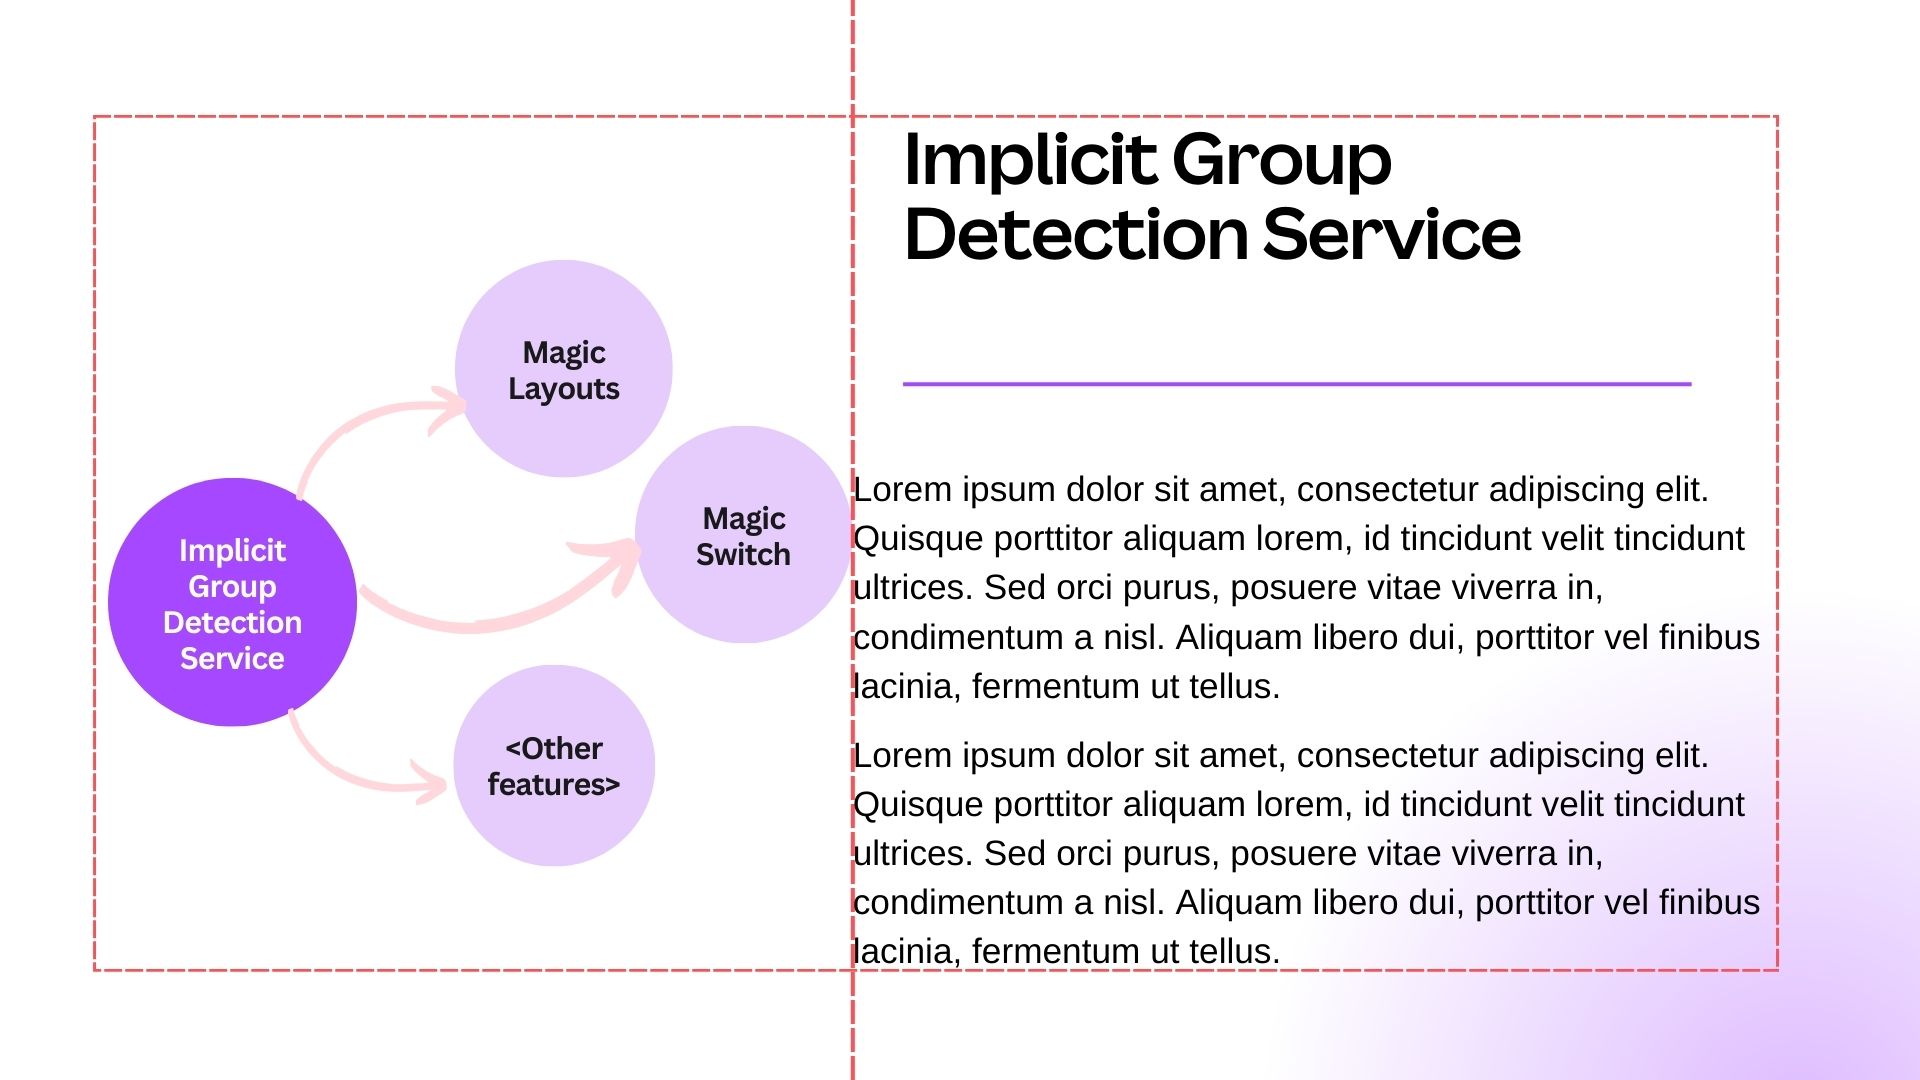
Typically, elements in a semantic design unit are closely positioned, so a logical approach is to identify these units based on the white space between elements. Theoretically, the white space within a design unit is less than the space between elements inside and outside the unit. This approach works well for sparse, grid-aligned designs.
However, identifying implicit groups based solely on white space can produce noisy results in designs with many elements. Complex designs have less white space, often include decorative graphics, and their elements aren’t always grid-aligned. Although we could dynamically model the grouping threshold relative to the design, this approach is challenging and lacks a universal formula.
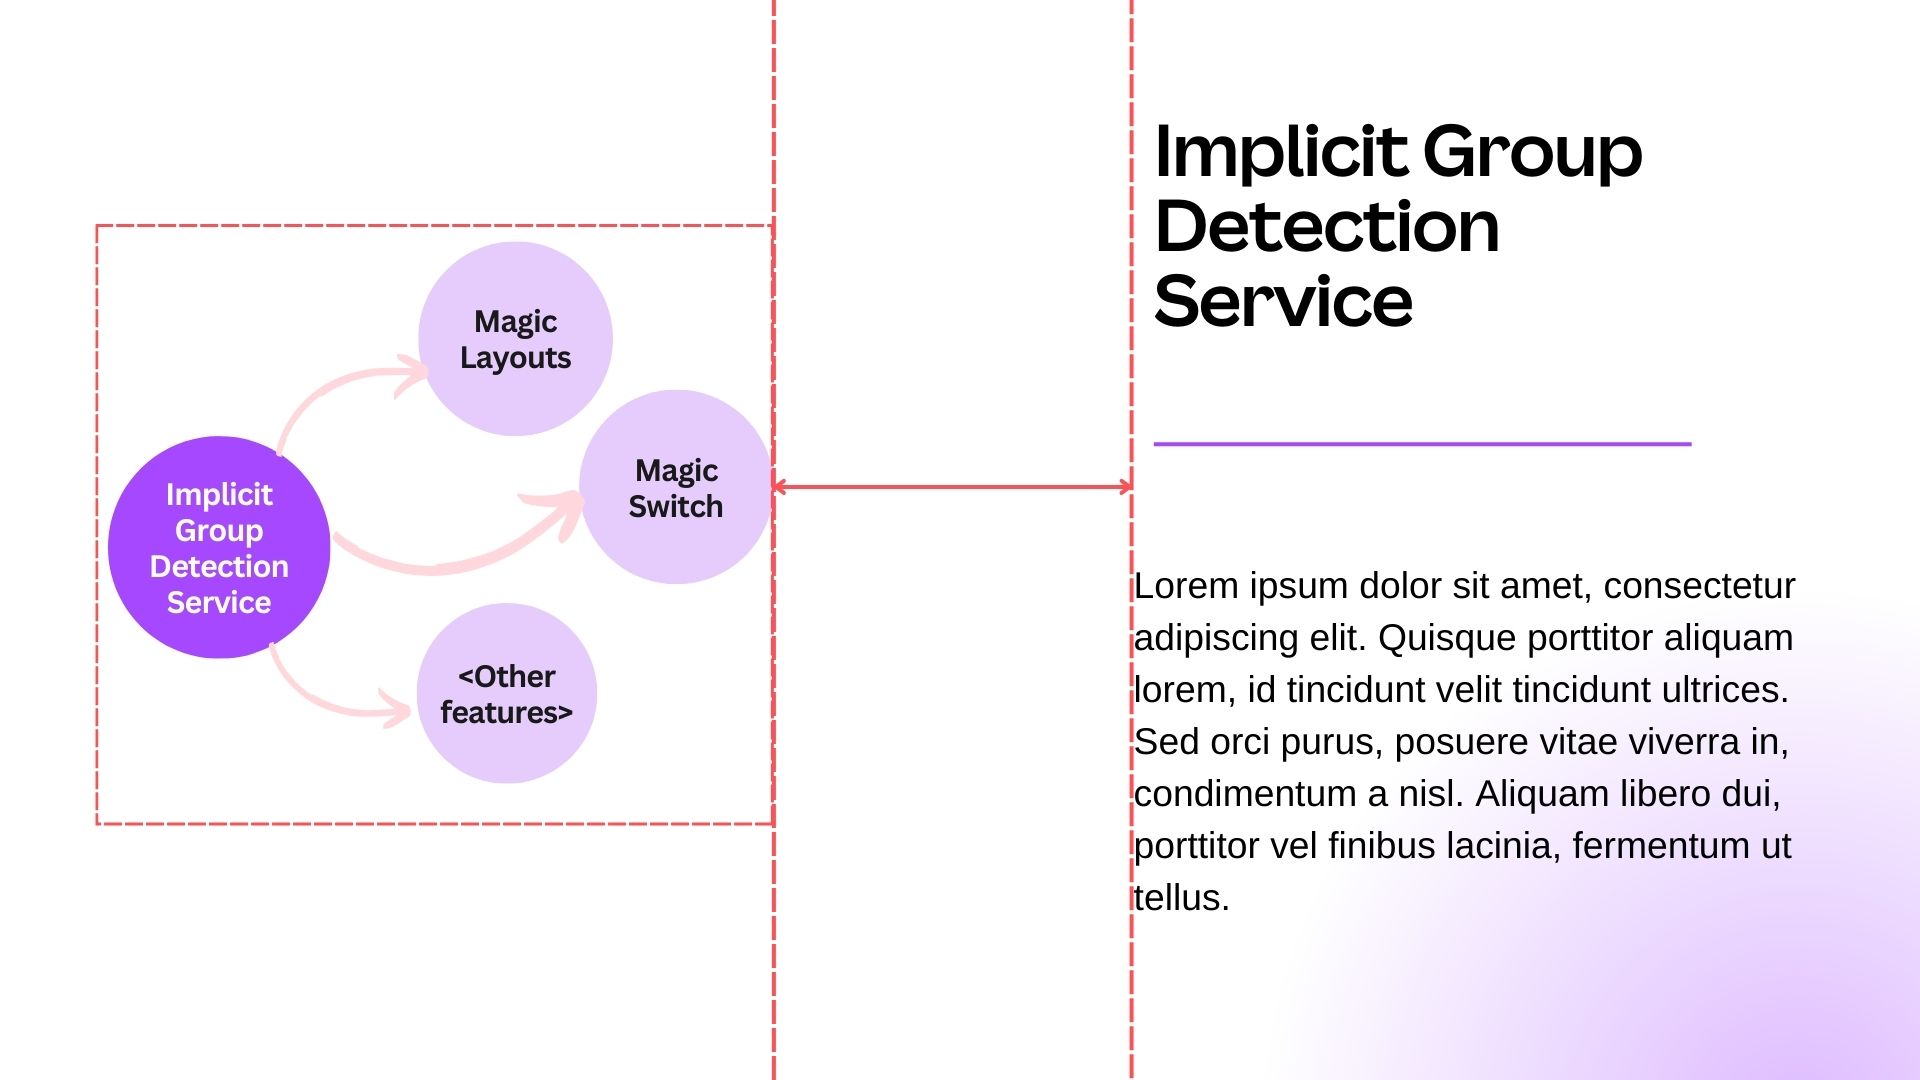
Additionally, there are scenarios in which elements separated by sufficient white space don’t form meaningful design units but might be falsely grouped together based solely on the surrounding white space.
Therefore, grouping elements based only on white space can lead to unexpected results and isn’t ideal.
You know it when you see it
The attributes (that is, the positions, sizes, and types) of individual elements don’t capture the whole composition of those elements, but their collective rendering does. At their core, Canva designs consist of a collection of positioned elements, but what users see are pixels. A design’s meaning comes from its visual composition. Handling this raster-element dual representation is a core problem when applying AI technologies to design.
Common immutable implicit groups have distinct visual features, such as:
- Tables
- Diagrams
- Charts.
Regardless of the elements used to construct these design units, they have a clear visual definition. You know it when you see it! This makes computer vision techniques ideal for identifying these implicit groups because they become the objects to detect in the design rasters.
System considerations
Having had early success training an object detection model to detect diverse tables, diagrams, and charts, putting this solution into production introduces a new set of considerations:
- We need to rasterize each design page into an image.
- User designs are sparse compared to natural images, because they’re structured and multimodal with a finite number of imagery and textual elements.
- We need to decode detected object bounding boxes and map them back to each element within those boxes.
In addition, Canva features using this implicit group detection require low latency and applicability across a wide range of design types. Therefore, we must consider:
- Maintaining low latency end-to-end from upload to detection.
- Handling varying quality, size, and aspect ratios of the rasterized design images.
The detection model
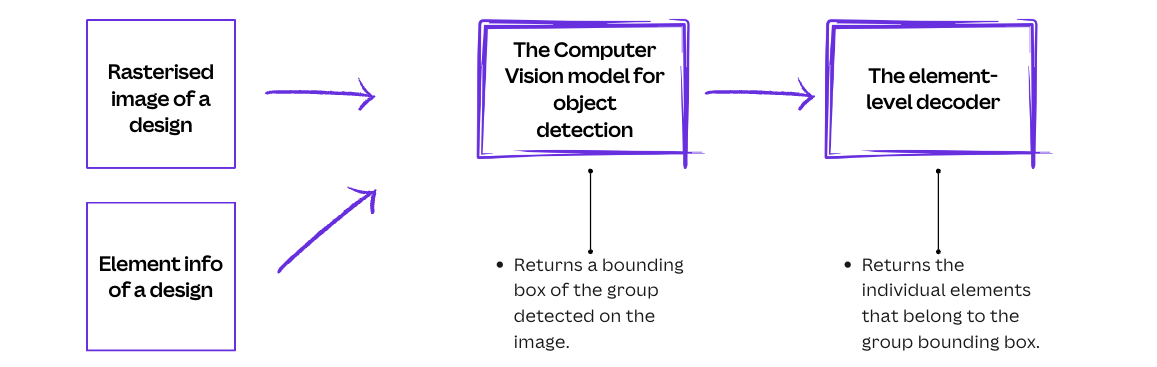
The detection model takes the rasterized image and design element information (for example, positions and types) as inputs, runs the computer vision model to detect bounding boxes of specific implicit groups, and uses the element-level decoder to identify each element that belongs to the detected groups.
The computer vision model
For the computer vision model, we chose a straightforward open-sourced Vision Transformer(opens in a new tab or window) model architecture. This encoder-only model has a set-based global loss(opens in a new tab or window). The Vision Transformer model captures the surrounding context of the sparse design, is compact with about 30M parameters and a file size of 25MB, and has an average inference time of around 70ms.
For model training, we use data from Canva's template libraries for both training and evaluation. We developed an in-house annotation tool to label immutable implicit groups in the dataset. We use this data to fine-tune an open-source model pre-trained to detect common visual features , including those of tables and diagrams.
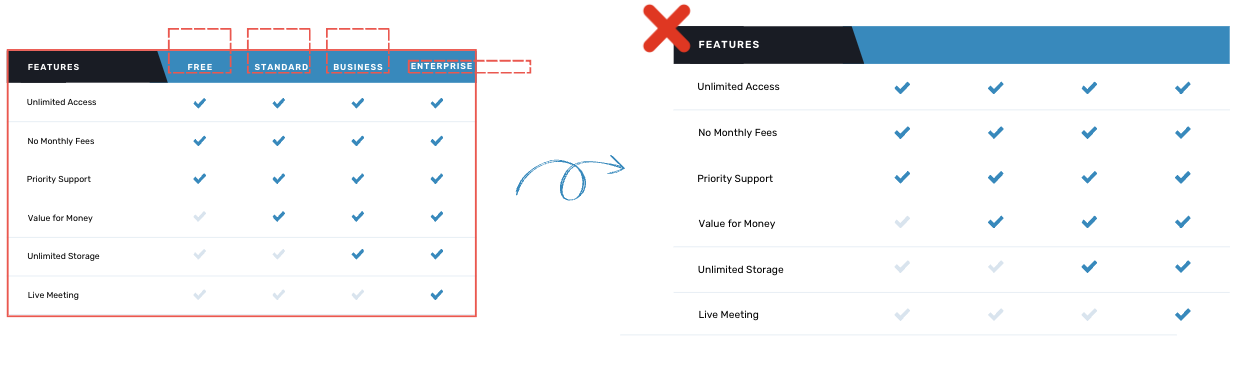
We recognize that a limitation of object detection is that it only detects axis-aligned objects, which may include false positives—elements within the detected bounding box but not part of the implicit group. Instance segmentation would be more precise for this issue, and it would be interesting future work. However, instance segmentation models are typically larger and have longer inference time. Given that this scenario is not common in our designs, we opted for the object detection approach as a trade-off.
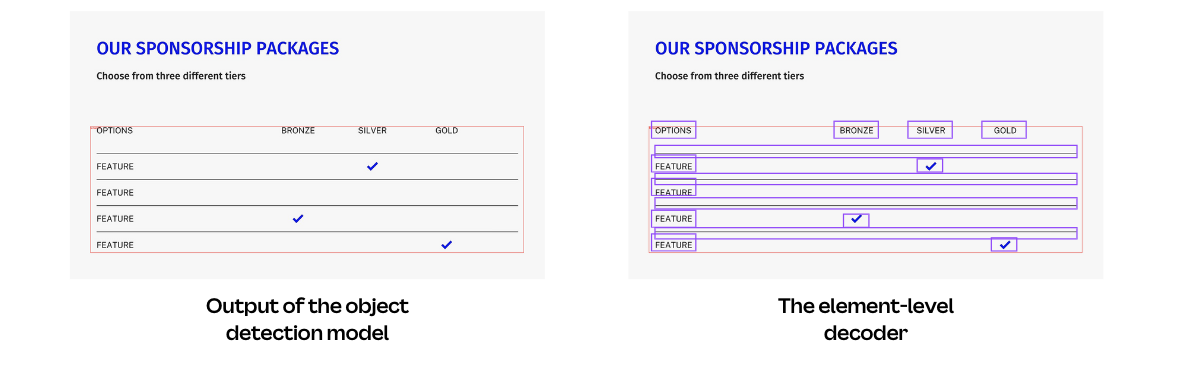
The element-level decoder
The element-level decoder needs to turn the pixel-based detected object box into a set of elements. Our initial approach returned all the elements whose bounding boxes substantially overlapped (minimum overlap ratio of 0.7) with the detected object bounding box.
However, the element bounding boxes are not always tightly aligned with the pixel information, whereas the computer vision model detects objects based solely on pixel data. If an element bounding box is padded with excessive white space, such as a text element with several empty new lines, it might not sufficiently overlap with the detected object bounding box, causing those elements to be excluded from their implicit group.
Instead of using element bounding boxes in the decoder, we use polygons wrapped around non-transparent pixels of the element. The extraction of element polygons, developed in-house in Canva based on the Gift Wrapping Algorithm(opens in a new tab or window), provides a more precise location of each element on the design raster and enables more accurate element decoding from the detected objects.
The impact of uploading a design raster
Although the model runtime is fast enough for many production applications, providing a raster of the design to the model would also incur a cost. This would either be the cost of rendering on the backend, or rendering on the frontend where all media and fonts were already loaded.
We knew uploading the design raster from the client web browser would significantly increase the request payload, thereby introducing extra latency. Accessibility is very important in Canva. To make our product accessible globally, especially where connections are bandwidth-constrained, we want to make things fast. Although this remains the lowest latency option to get the raster to the detection model, we were uncertain about the impact on the user experience of the relevant features.
We conducted an A/B test to evaluate the impact of uploading a design raster as part of the feature request payload. The results showed a decrease in feature usage due to the increased response time, particularly affecting users with slow network connections. To maintain a good user experience, we knew we had to significantly reduce the raster file size while maintaining high model detection accuracy.
We converted the design raster to JPEG format, which uses lossy compression and significantly reduces data size for typical designs compared to PNG format. We also ensured that we trained our model on images with JPEG compression artifacts. On the client side, we set the image quality to medium when converting the raster to image bytes for the request payload (canvas.toDataURL("image/jpeg", 0.5)).
Our designs typically have large dimensions, such as 1920x1080. To further reduce image size, we rasterized the designs to a quarter of their original size at most, depending on the size of the original image. This minimized the image payload without compromising the performance of the computer vision model. However, although we resized the input image, the element positions remained relative to the original dimensions. Therefore, we also needed to scale the detected object bounding boxes back to the original dimensions before decoding the individual elements.
This optimization significantly reduced the image payload size, keeping the response time low while maintaining the high accuracy of the detection model.
Robustness in the detection
Canva designs are full of creativity and variations, so our detection model needs to be robust across diverse designs. This applies not only to the size and quality of the design images but also to the elements and their compositions in the designs.
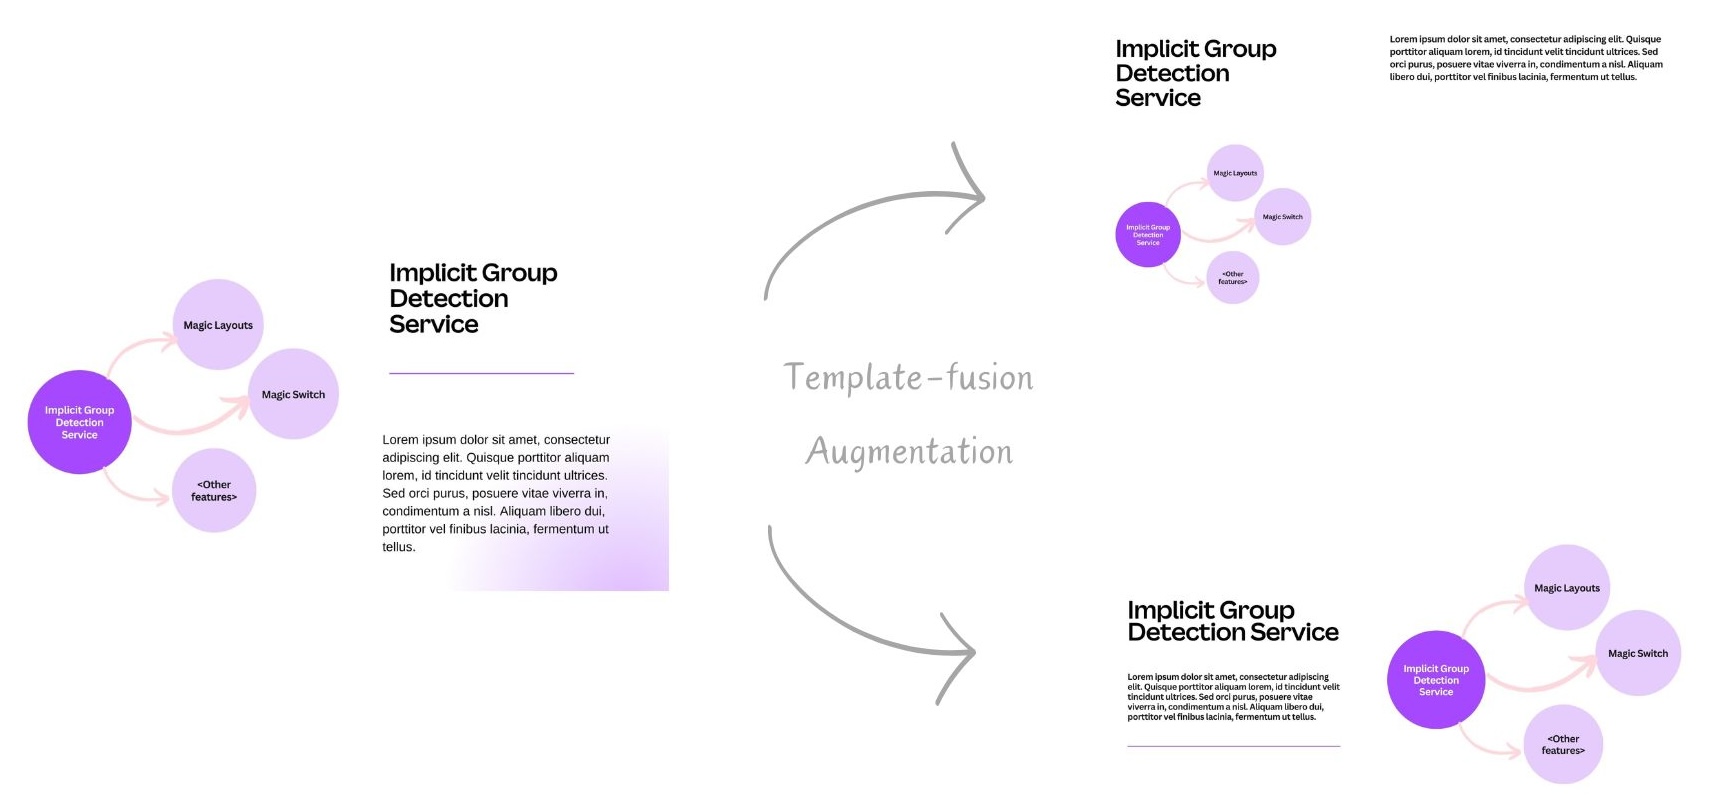
To make the object detection model more robust, we incorporated various data augmentation techniques in our training dataset for model training. In addition to the standard practices in computer vision, such as rotation, crop, zoom-out, and flip, we developed an in-house template-fusion augmentation, which places an annotated object into a completely different context. We took a sample of template pages and identified images that we could replace with something like a diagram. Replacing those images, we randomly fused our annotated implicit groups with diverse templates. This template-fusion mechanism further augments our training data and enhances the model’s robustness.
Try it out!
Build a diagram in your design and you’ll see it seamlessly integrated into your layout alternatives or in the designs you switch to!
If you’re making a 16:9 presentation, you can find Magic Layouts(opens in a new tab or window) in the Design tab on the editor side panel. Select the Layouts sub-tab to see the layout suggestions. The Magic Switch(opens in a new tab or window) feature is on the top Canva menu. Select Resize & Magic Switch and then Transform into Doc to start transforming your designs with AI.
Conclusion
To give users simple and inspiring design experiences, we need design AI solutions that view a design as a collection of elements but also as an emergent composition. We continue to extend group detection and other AI technologies in design using these principles. The challenges of AI for design, and the complications of the raster-element interface, drive us to continuously seek better solutions.
Acknowledgements
Huge thanks to Joel Nothman(opens in a new tab or window) for initiating the exploration in this space as well as thoroughly reviewing this article, and to Nick Parker(opens in a new tab or window), Seoyoung Choi(opens in a new tab or window), and Philton Zhu(opens in a new tab or window) for their work together to bring this feature live.
Also thanks to Paul Tune(opens in a new tab or window) and Grant Noble(opens in a new tab or window) for reviewing this article. A shout out to everyone who provided enormous support for this project.