Infrastructure
Faster continuous integration builds at Canva
How we improved our continuous integration build times from hours to less than 30 minutes.
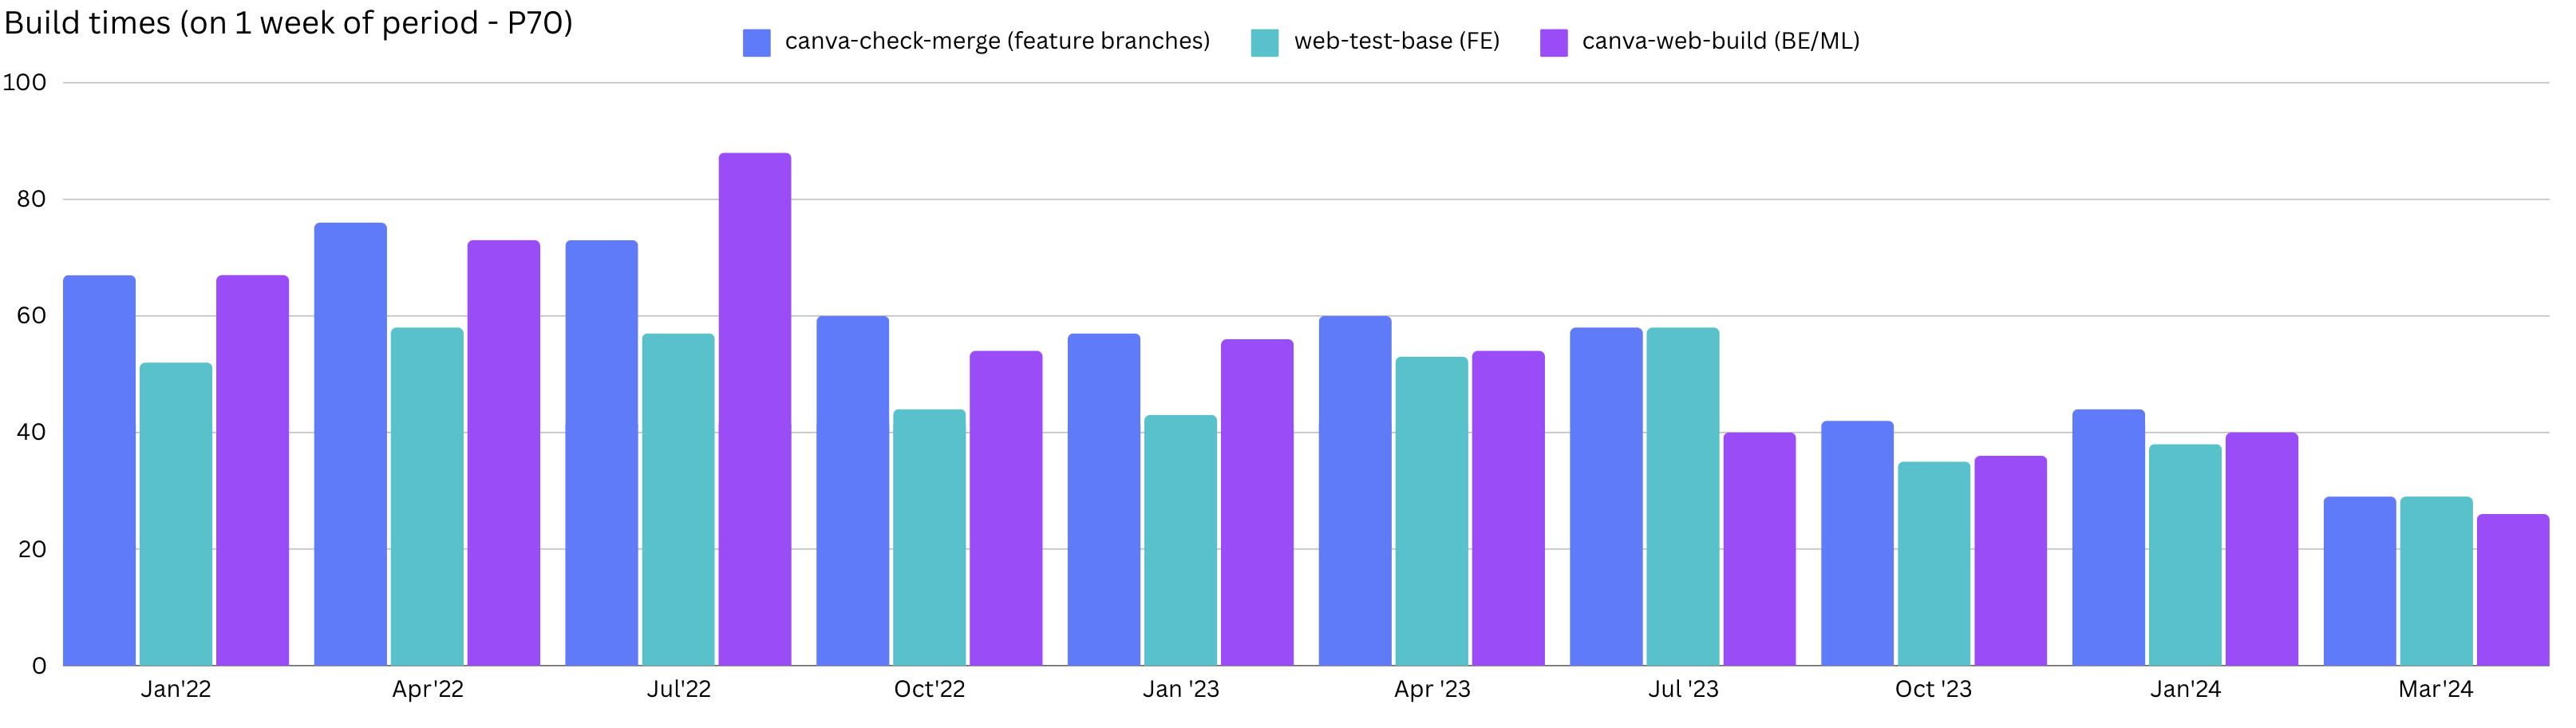
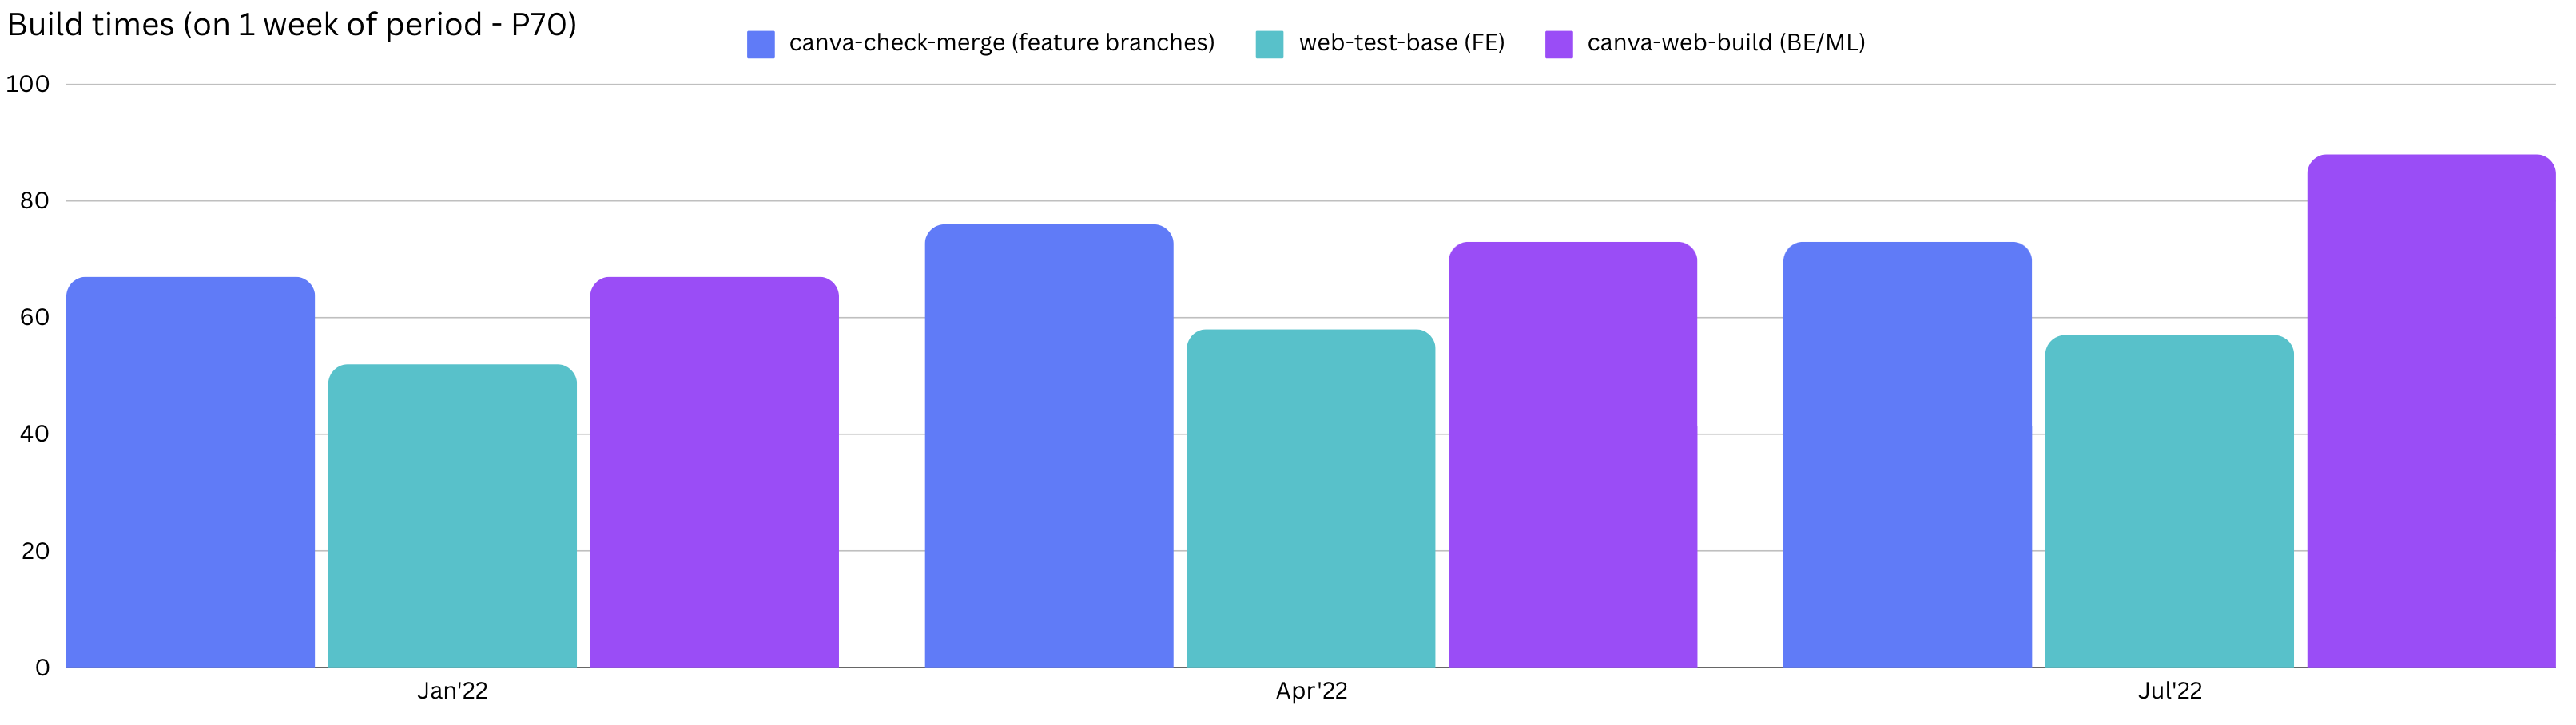
In April 2022, the average time for a pull request (PR) to pass continuous integration (CI) and merge into our main branch was around 80 minutes. As shown in the following diagram, we’re now getting our CI build times down below 30 minutes (sometimes as low as 15 minutes).
In this blog post, we’ll share what we’ve done to improve CI build times in our main code repository, including:
- Finding the best opportunities: Working from first principles to discover where the gaps are.
- Experimentation: How we validated our understanding of the problems and explored different directions we could take to solve them without spending too much time.
- Deliver fast and incrementally: How we made CI incrementally more efficient.
- It takes a village: The importance of everyone’s contributions and how we all need to be working towards the same goals.
As an engineering case study, our CI has some interesting properties:
- It’s a decently sized distributed system: It has many components distributed across thousands of (fairly powerful) nodes.
- It has a non-trivial workload: Our build graph has more than 10^5 nodes and some expensive build actions (5-10 minutes), which run often.
- It has many downstream dependencies: All these dependencies affect CI performance and reliability. Some dependencies are outside Canva, such as AWS, Buildkite, GitHub, and internet mirrors (NPM, Maven, Pypi, and so on), and some are in Canva, such as the code that goes into building and testing software (including all its transitive dependencies).
- It has a critical path(opens in a new tab or window): CI performance is bound by its longest stretch of dependent actions. Because our CI has so many dependencies, it’s difficult to avoid regressions even when we improve things. One bad downstream dependency makes CI build times longer for everyone.
Canva’s CI workflow
In this post we talk a lot about the check-merge pipeline and its associated branches.
So let’s do a quick overview of Canva’s CI workflow and pipelines. The following diagram is
a high-level view of the flow, with branches on top and pipelines below them.
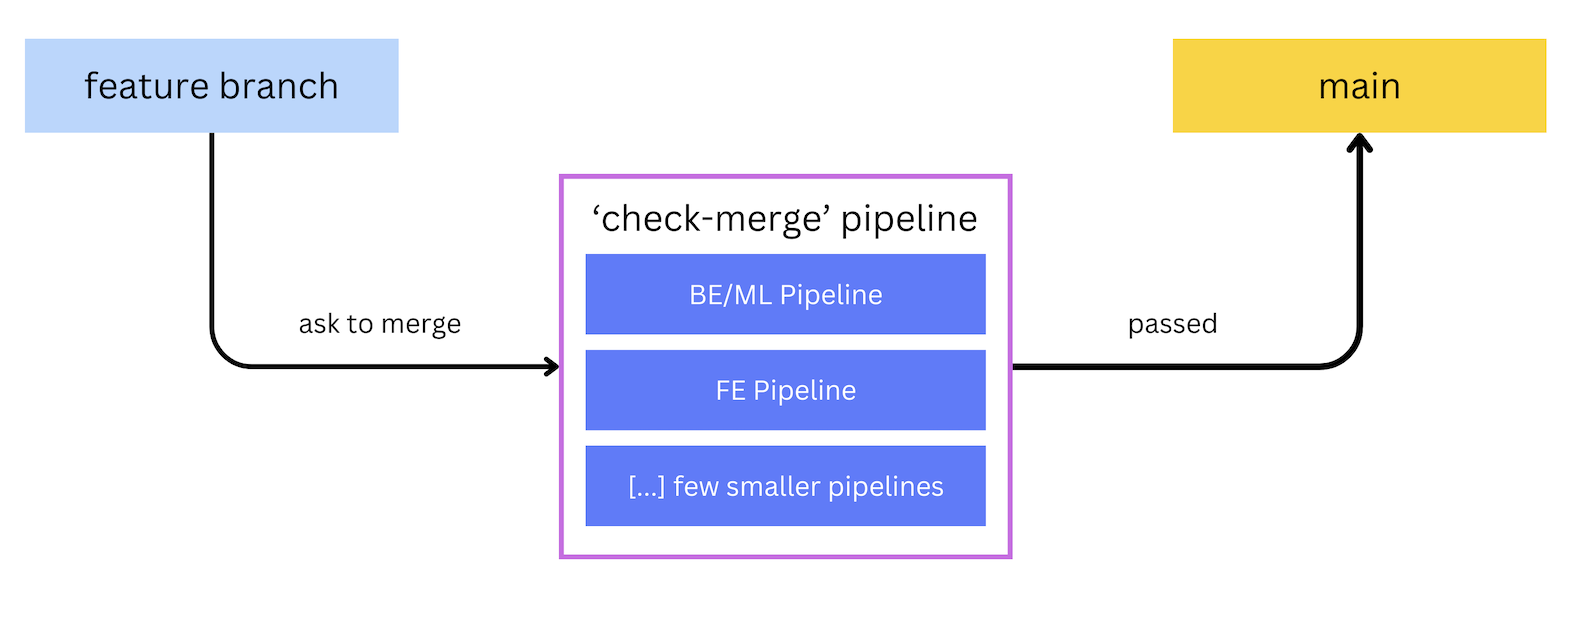
When an engineer asks to merge a PR, CI executes a merge pipeline (check-merge).
This pipeline contains the following sub-pipelines: a BE/ML pipeline (for backend and machine
learning builds and tests), an FE pipeline (for frontend builds and tests), and a few
other smaller pipelines (which aren’t as relevant, so we’ve omitted the details).
If check-merge passes, the PR merges to the main branch, where all feature code branches come
together to check if they can be successfully integrated. The rest of this post
describes how we improved our CI build times.
Finding the best opportunities
In the midst of chaos, there is also opportunity. - Sun Tzu
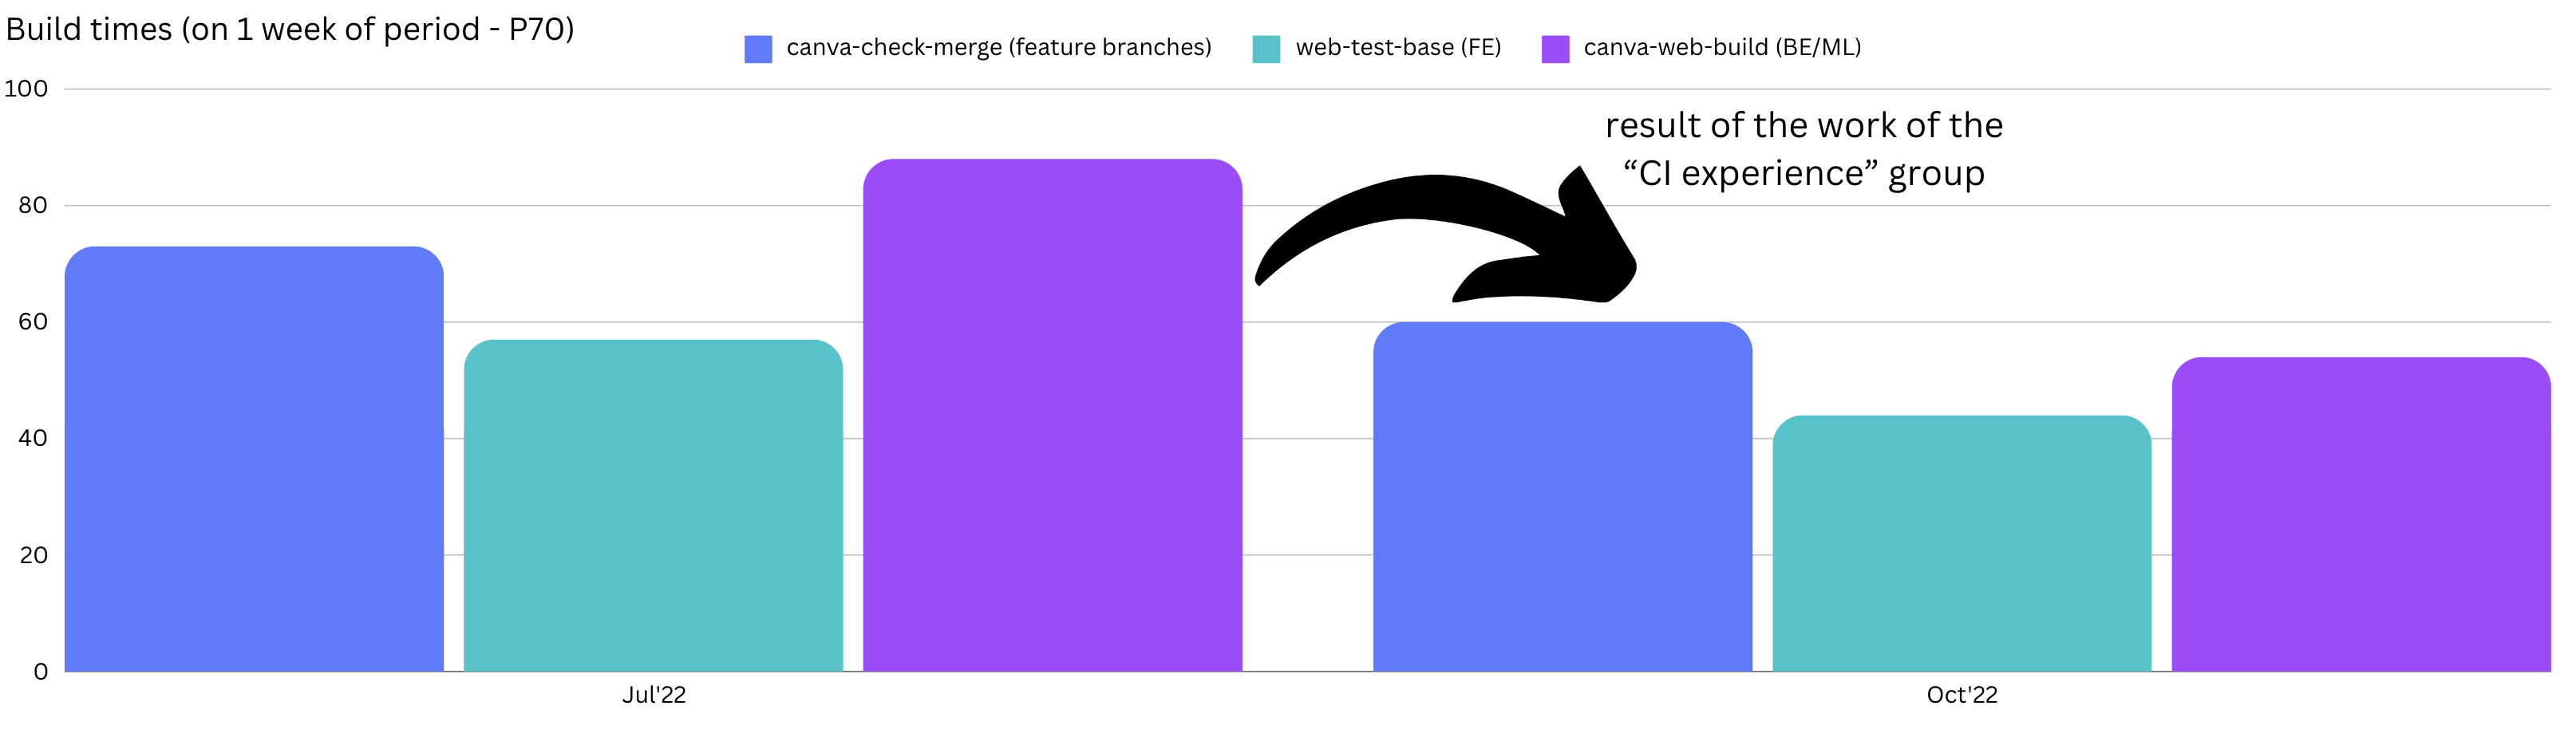
In the first half of 2022, our CI build times were getting progressively worse. In July 2022, build times to merge a feature branch into main often exceeded 1 hour.
However, we were working to find opportunities and make things better. In June 2022, we formed a CI Experience working group with many people from different teams in our Developer Platform group. The working group found and fixed many easily solved problems, such as:
- Preventable Bazel cache issues with Docker images and build stamping.
- De-duplication of Bazel targets across pipelines.
- Fixing pipeline structures by merging or removing steps where applicable.
The following diagram shows the result of that work.
We also started some longer-term investigations and initiatives, including:
- A pipeline audit to better understand its steps and identify the big improvement opportunities.
- The Developer Environment and Test Platform teams began converting backend integration tests into Hermetic(opens in a new tab or window) Bazel tests to take advantage of Bazel’s caching and parallelism.
- The Build Platform team started exploring Bazel Remote Build Execution (RBE(opens in a new tab or window)) to distribute our Bazel workloads more efficiently.
- The Source Control team was improving the performance of Git repository checkouts and caches.
Each team employed its own methodologies to understand the opportunities. We used first principles thinking to develop an intuition of how fast CI could be. Then, through experimentation, we inspected every part of the process to find out where the differences were (for more information, see experiments). From first principles, we knew that:
- Modern computers are incredibly fast (try this fun game(opens in a new tab or window)).
- PR changes are relatively small (a couple hundred lines on average).
- One build or test action shouldn’t take more than a few minutes on a modern computer, and the critical path shouldn’t have more than 2 long actions dependent on each other.
So, if we assume a few minutes = 10 and multiply that by 2 (2 actions dependent on each other, each taking 10 minutes), we have a theoretical limit of approximately 20 minutes for the worst-case build scenario. However, we had builds taking up to 3 hours! What was causing this massive difference? As it turned out, our horizontal scaling of CI was very inefficient. We moved a lot of bytes around before doing any relevant build or test work. The following sections describe some of these inefficiencies.
Too many steps in CI
Our CI system grew based on the assumption that we can always scale (horizontally) by adding more:
- CI (build and test) work by creating more CI steps.
- VM instances to the CI worker pools so that CI dynamically scales with the jobs’ demand.
In theory, we could continue to grow the codebase (and the amount of CI work to build and test it) while keeping the total time to execute the pipelines constant.
However, with this strategy, we had around 3000 jobs (P90) for each check-merge build. And
because each job required one EC2 instance during its execution, and we ran more than 1000
check-merge builds per workday, it resulted in:
-
Intensive use of compute and I/O:
- Downloading Petabytes worth of dependencies every week.
- Over 300 hours of compute time (P90) to execute a
check-mergebuild. - Over 50 hours of compute time (considering 1 minute average P90) per build, before doing any CI work. Some preparations would take up to 5 minutes (with a cold nix cache) executing processes such as git checkout or clean, setting up the environment, and checking or killing hanging processes.
-
Inefficient CI instance pools: Because each job requires one EC2 instance and our pipelines had a lot of steps we inadvertently caused:
-
Frequent cold caches: Because of the high variance in scheduled CI jobs (and therefore, in the auto-scaling group’s desired capacity), instances tended to be short-lived. So, all local caches, including build outputs and third-party dependencies, were discarded when the instance terminated.
-
Pressure on third-party dependencies: We download a lot of dependencies. At agent startup, we download GBs worth of artifacts, including a snapshot of our large repository and (many) third-party packages. In the steps, we download GBs more, for example:
- Nix derivations through nix-shell (inside or outside of Bazel).
- Bazel repository rule dependencies (toolchains, Maven, Pypi, S3, and so on).
- NPM module downloads.
- Buildkite artifacts (downloading and uploading artifacts to Buildkite’s S3 bucket).
-
High warm-up and idle cost: The large demand for instances also increased cost. During warm-up (that is, a cold-start), we downloaded and installed many dependencies on top of the AMI. Because of idle time, the agent waited for a given amount of idle time (10-60 minutes), before shutting itself down. During warm-up and idleness, our instances are not doing CI work, therefore burning costs.
-
Demand spikes: The pipelines that had many steps caused spikes in our scheduled jobs, which could surpass CI’s available capacity. This caused increased wait times because they needed to do the warm-up procedure before being available to do work.
-
Increased chance of failure: The more components (in this case, instances) involved in the build, the higher the failure probability. For more information, see Reliability of Systems(opens in a new tab or window).
-
Arbitrary commands in steps and pipelines
We allowed anyone to add arbitrary commands (for example, any script or binaries in the repository) to CI. This freedom made adding new stuff to CI faster and easier for the build or test author. However, it resulted in significant efficiency and CI health drawbacks, such as:
- Steps weren’t hermetic or deterministic, wrapped as a Bazel build or test. So they:
- Can’t run in parallel because they can affect each other’s output (that’s why a job would take a whole EC2 instance). This caused under-utilization of instance resources (a large percentage of CPU on our workers sitting idle).
- Can’t be cached because we don’t have a full definition of their inputs.
- Can’t be easily isolated because CI doesn’t control which side-effects they cause or which dependencies they have.
- Can cause flakes by leaking state into other steps, inadvertently leaving open processes and file descriptors, or modifying files in a way that might affect other steps.
- Are hard to run locally because many of them have implicit or hard-coded dependencies in the Linux or Buildkite environments (of CI).
- Having pipeline generators and step definitions with complicated conditionals that were incredibly fragile (for more information, see could we make pipelines simpler) in an attempt to make them more efficient.
Bazel was the promise to fix all of this, but it had its challenges.
The challenge of achieving fast and correct with Bazel
Bazel promises fast, incremental, and correct builds by providing features such as sandboxing, parallelism, caching, and remote execution. However, there were many challenges in fulfilling these promises. Bazel:
-
Is slow to start.
Loading and analyzing the build graph to generate the necessary actions from the
/WORKSPACE,**/BUILD.bazel, and*.bzlfiles, plus the filesystem and cache state, might take minutes, especially when you include many targets. It didn’t help that we had a build graph with over 900K nodes. -
Adds significant execution overhead because of process sandboxing (Bazel’s default, but not only execution method(opens in a new tab or window)).
Bazel symlinks each file declared as an input dependency (to prevent non-hermetic changes) for each process sandbox. This is expensive when you have thousands of files in each action (such as
node_modulesfor frontend actions). -
Is hard to migrate builds and tests into because you must declare every input that a rule depends on, which requires a significant amount of time, effort, and some Bazel-specific knowledge.
-
Is hard to make “Remote Build Execution” (RBE) compatible because it requires the worker pool to provide the same inputs to the actions as local execution would (that is, be truly hermetic).
What we learned
At this stage, we knew that:
- Having a lot of steps as a form of workload distribution was highly inefficient.
- Accepting arbitrary commands and scripts in CI made the author’s lives easier, but was bad for overall CI performance, cost, and reproducibility.
- Bazel needed some work before it could fulfill its promise.
Our biggest challenges and opportunities were to:
- Make our build and test commands more efficient (for example, making them cacheable).
- Optimize the distribution of the CI workload (for example, reducing the amount of I/O involved).
Experiments
A pretty experiment is in itself often more valuable than twenty formulae extracted from our minds. - Albert Einstein
Experimentation is an important tool in the engineering toolbox. One of an engineer’s greatest superpowers is knowing how to quickly explore a problem space and its possible solutions through experimentation. However, experimentation is often misunderstood and underutilized. This is likely because it’s easy to confuse the shaping phase (exploring a problem space at high velocity) with the building phase (building it to last).
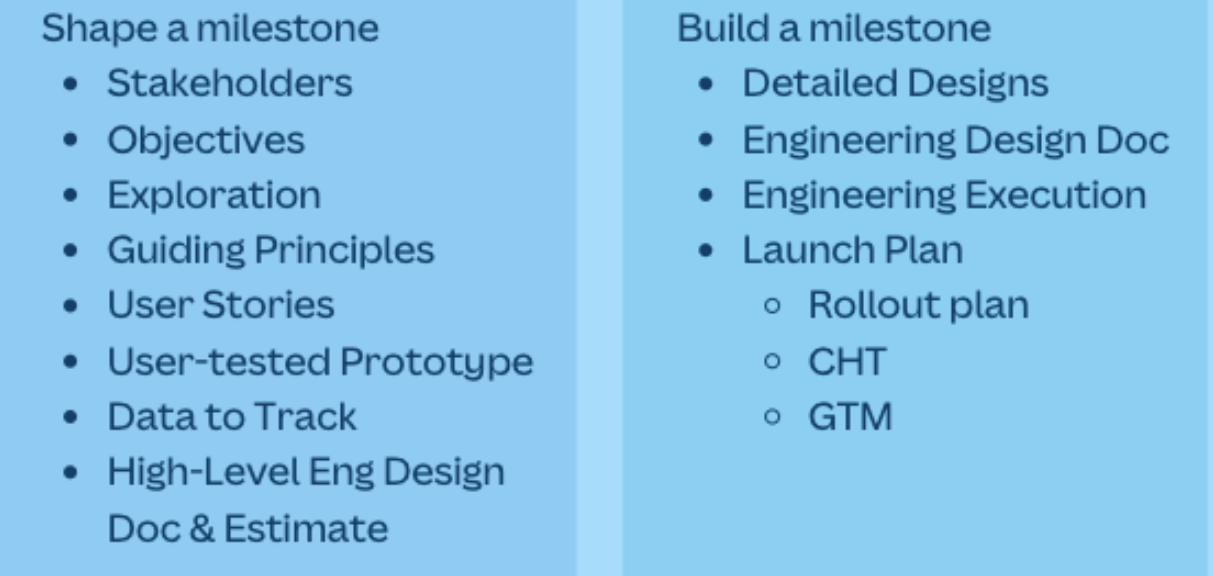
At Canva, we have a framework called the Product Development Process (PDP), which gives us great tools to shape, build, refine, and launch products. In this section, we’ll focus on the difference between shaping (milestones) and building, as described by our PDP.
When you treat the building phase as shaping, those little temporary things go into production before getting an appropriate polish. They're likely to be poorly thought out, poorly written, and poorly tested, therefore buggy and hard to maintain, inevitably resulting in a poor product or service.
On the other hand, treating the shaping phase as building is when you write design docs or PRs before properly exploring the problem space. It wastes a lot of time and likely results in a fragile proposal, painful review cycles, walls of text, wasted time, and frustration for you and the reviewers.
In the shaping phase, you should:
- Explore the breadth of possible solutions and their consequences before committing to one.
This reduces the risk of you becoming a victim of the sunk cost fallacy (where you overcommit to something you’ve already spent considerable time on).
-
Find peers to brainstorm. Collaboration in this phase aims to explore different ideas without the burden of commitment and approvals. Inviting your peers, especially those with experience in the problem space, can yield fantastic results.
-
Avoid sending PRs for review or creating fancy infrastructure. You can do more than you think in your Mac, DevBox, or burner account. That’ll save a lot of time, by avoiding:
-
Perfecting code that doesn’t solve the problem. There’s no point in making beautiful code that doesn’t solve the problem.
-
Review cycles. Saving time for you and all the reviewers involved. This is especially beneficial given that the code might change many times until you find a suitable solution. And perhaps it’ll be discarded without ever being promoted to production.
-
Creating production-grade infrastructure for a solution that doesn’t work. Most of the time, you can get by with mocks, local containers, or burner accounts, which are much quicker to spin up. This is especially true if your fancy infrastructure depends on creating PRs and involves other teams, which might block you.
-
Only after you’ve explored and built confidence that you have a solution that works should you proceed to the build phase (for example, write proposals and get the appropriate approvals). At this point, you’re significantly more likely to have a good solution. And your solution is less likely to be controversial because you’ve done your homework.
Our CI experimentation
In the second half of 2022, we had plenty of questions and ideas for the CI platform that we wanted to explore and play with. How could we achieve better resource efficiency for our Bazel steps? Could we have a single instance that builds the whole repository? Did local resources constrain it? Could we fit everything in RAM? How long would that take?
We created a test CI instance with the same configuration we had in production.
We first tried executing bazel build //… to see how long it’d take to build.
The Bazel JVM ran out of memory because the graph was too big. We could increase
the JVM memory, but that would likely force the OS to use swap memory.
So, we discarded that idea.
We then excluded the /web directory and package (that is, bazel build – //... - //web/...),
which we knew had many targets and nodes. That worked. So we ran that tens of times in
test instances, monitoring the execution with tools like top and iotop to see
where the bottlenecks were.
Observing that disk IOPS and throughput looked like the main bottlenecks, we tested with larger instances to see if there was an opportunity to use more RAM and less disk (which was backed by EBS(opens in a new tab or window) at the time and is generally slower than local disks because they’re network mounted). We even tried a giant instance (448 CPUs and 6 TB of RAM), putting the whole codebase and Bazel’s working directory in RAM to see how fast it could be. It still took around 18 minutes to execute on a cold cache, indicating that a few actions on the critical path were bound by the speed of a single CPU.
After much testing, we eventually launched more efficient instance pools using the i4i(opens in a new tab or window).8xlarge instances for the build all step (our slowest at the time). That instance type gives us multiple SSDs and is very good for I/O heavy workloads. It worked well with Bazel caches, sandboxing, and containers, reducing the job runtime from up to 3 hours to around 15 minutes. It also increased our confidence to use a similar approach with other steps in the pipeline.
Bazel’s “build without the bytes”
Before executing any build or test action, Bazel checks if the result is in the cache (one of its layers). If it’s in the remote cache, it downloads the result (that is, the built artifacts).
At Canva, we’ve long had a Bazel cache shared across all CI workers. It’s a simple setup but amazingly effective. It’s a service called bazel-remote(opens in a new tab or window), installed on every instance, backed by an S3 bucket as its storage. So, the gRPC communication between the Bazel server and the cache happens locally, but it’s supported by global shared cache storage.
While experimenting with large instances (see our CI experimention), we learned 2 things:
-
We downloaded hundreds of GBs worth of artifacts (mostly containers) on every backend build.
-
Bazel has a mechanism called build without the bytes (BwoB). It has a
--remote-download-minimalflag that prevents Bazel from downloading the result of an action from the cache unless another action (like a test) needs it. So we knew it had the potential to save a lot of network I/O and time.
We experimented with this, and it looked like a big win. Cold builds (of the whole repository, excluding /web)
could be as fast as 2.5 minutes.
However, during experimentation, we also learned that builds could fail if artifacts were (ever) evicted from the cache(opens in a new tab or window). We obviously couldn’t let the S3 bucket grow forever, so we feared long-tail issues if we used our bazel-remote S3 setup.
After learning of this cache issue, we experimented with a simple workaround of retrying when those (fairly rare) cache check failures occur. It worked really well and we rolled it out.
This workaround improved backend builds by 2x (from around 10 to 5 minutes) and machine learning builds by 3.3x (from around 6 minutes to less than 2). We now do this on all Bazel steps (including tests).
Could we make pipelines simpler?
Our pipelines using our Typescript generator were often very slow to generate and had fairly complicated definitions.
So, we made a proof-of-concept (PoC) in Bazel to see if it could be simpler and faster. In this new generator, we declare the pipeline configuration in Starlark(opens in a new tab or window) (Bazel’s configuration language), which we convert to YAML, as Buildkite expects.
It resulted in a significantly simpler pipeline generator than its Typescript counterpart because the configuration significantly limits the complexity (that is, there are no side effects, and it’s hermetic by design(opens in a new tab or window)) we introduce into the pipeline definition. The PoC ended up being the base for our current pipeline generator. This new generator simplified our main pipelines from many thousands of lines of code to a couple hundred.
Deliver fast and incrementally
Great things are not done by impulse, but by a series of small things brought together. - Van Gogh
After all our experiments, we were confident we had solutions to make CI significantly faster, simpler, and more cost-effective.
But because CI was already slow, flaky, and painful, we didn’t want to promise a solution that would take forever. We wanted to deliver fast and incrementally. One of our core values is to dream big and start small. And it’s often great for any goal or strategy that will take months. Incremental delivery lets us:
- Make our users happier sooner while we work on our next big thing.
- Learn what works and what doesn’t sooner. Big mistakes happen often in projects that take years to deliver.
You generally want to break big goals into multiple steps, with each delivering incremental value and leading towards the bigger goal.
Hermetic backend integration tests (TestContainers)
Previously, backend integration tests were non-hermetic (and therefore not cacheable).
This meant that each build ran every test, with this step easily pushing over 50 minutes.
These tests were not hermetic because they depended on a single set of storage containers
(localstack) starting before running tests. This made the tests flaky because all tests
were running against and overloading the single set of storage containers. Some tests
required exclusive container access, leading to complex test parallelism and ordering.
The Developer Runtime team developed a framework for hermetic container orchestration using
the TestContainers library, allowing each test to control its distinct set of storage
requirements within the confines of a Bazel sandbox, ultimately allowing us to cache these tests.
Service container tests and hermetic E2E
The Verify Platform team extended this hermetic container orchestration framework to cover Canva backend service containers, with each service having its own TestContainer implementation and associated Service Container Test (a test validating that the container can launch correctly). This shifted many common deployment failures to CI, and is a significant step towards deprecating the non-hermetic full-stack tests.
We then used these service container definitions to compose hermetic E2E test environments, allowing E2E tests to be cached, with rebuilds required only when modifying a service involved in the test. The reliability of the new E2E framework also significantly improved over the previous iteration because each service container is hermetically tested in isolation, making failures much easier to detect and diagnose.
BE/ML Pipeline v2
The previous experiments and work (the simpler pipeline generator, the larger agent pools, and the pipeline audit) gave us enough knowledge and confidence to take the next big step: grouping the steps in the BE/ML Pipeline to improve its efficiency.
We were initially hesitant because grouping steps would change the UX. However, we also knew that launching was the best way to validate the idea and determine if we could expand it to the FE pipeline.
In April 2023, we rolled it out after adjusting the pipeline generator steps and asking for feedback from some engineers. It resulted in:
- Reduced build times, on average, from 49 minutes to 35 minutes.
- Reduced dependency pressure, from 45 to 16 steps (and build minutes by around 50%).
Inadvertently, we broke a few dependencies we were unaware of (for example, observability tools from other teams). We needed to do a better job managing and decoupling our dependencies and be more careful on subsequent rollouts.
Overall, the wins and learnings were important stepping stones toward our next big milestone: a new FE pipeline.
FE Pipeline v2
After the BE/ML Pipeline revamp, we attempted a similar approach to improve the FE pipeline's efficiency.
The pipeline triggered a sub-pipeline build for each affected page or UI package. This added a large overhead (making it inefficient and expensive, for the reasons we discussed in Finding the best opportunities). As a result of trying to avoid this overhead, we'd created an intricate and fragile set of conditionals and branches.
We hoped grouping steps would make FE builds faster and simpler and reduce costs. However, after some experimentation and grouping those steps into a smaller and simpler version, we hit a few problems:
-
Bazel query and
bazel-diff(opens in a new tab or window) on the pipeline generator were too slow.bazel-diffused to be generated and evaluated against Bazel queries (defined per step) in the pipeline generator. It took more than 10 minutes to generate the pipeline, which isn't good because it’s on the critical path. -
The frontend integration tests, as they were, couldn’t be grouped in a realistic number of instances. The tests required a massive number of instances to execute them. This was one of the reasons why we saw large spikes in agent demand. A single build could require hundreds of agents to execute integration tests. Because multiple builds are requested close to each other at peak times, the spike in demand would increase agent wait times and require more than 1,000 instances to be started.
With these findings, we decided to:
-
Drop
bazel-difffrom pipeline generation for the CI pipelines.We could leave the work of figuring out what to execute to Bazel’s native caching mechanism. Although we knew it was a bit less efficient than
bazel-diff, we also knew it was simpler and less prone to issues with correctness. We would revisit the problem later, by moving the conditional evaluation to the job run-time (see a faster pipeline generation). -
Try to bazelify the frontend integration tests. It would be ideal if integration tests could take advantage of Bazel’s caching and parallelism.
-
Try to bazelify the accessibility (a11y) tests. Although not as time or cost-intensive as integration tests, accessibility tests were also hard to group. They took more than 30 minutes to execute in a single instance. Perhaps we could bring them to Bazel too?
To avoid the same issues we had when launching the backend pipeline, we worked hard to decouple all the dependencies entrenched in the FE Pipeline.
Frontend integration tests in Bazel
The frontend integration tests were an interesting opportunity. We were confident we could make them more efficient by converting them to Bazel, taking advantage of its parallelism and caching. But how big was the opportunity?
First, we did some rough estimations of the potential impact:
-
Time: It’s hard to guess how much we can save without knowing how long Bazel tests would take in practice and what sort of cache hit ratio we’d get. If we guess a 50% improvement (which might be reasonable), we’d save 98M minutes per year.
-
Money: We estimated that by EOY 2022, each build minute costs, on average, $0.018. So, saving 98M minutes per year would save 1.8M $USD. Even if this was optimistic, it seemed like a great opportunity to deliver big savings.
-
Number of steps per agent: In 30 days, we execute around 1.5M frontend integration jobs for 14915 commits (an average of about 100 jobs per commit). If we had them in Bazel, we could reduce that to 1 job per commit. Being pessimistic and distributing in 10 jobs (in the end, we ended up with 8), we’d still reduce about 90 jobs per commit, reducing around 1.3 M jobs/agents per month. That’s a lot of agent warm-up and downloading that we’d save.
Given these numbers, we were confident (discounting our cache hit ratio guesses) that they’d have a big impact. And it’d be another step towards making most of our CI tests homogeneously managed by Bazel.
But what about effort? We had no idea how hard it’d be. At the time, there was a lot of uncertainty regarding how hard it was to declare all the input dependencies and wrap tests in Bazel. So, again, we did a quick PoC. Surprisingly, it was pretty straightforward. Although we had some challenges to solve (for example, dynamic dependency discovery and flakes because of resource contention), they looked very managable.
So we started a working group, mitigated the issues, and it was ready to launch.
To avoid duplication of work, we launched it together with the new frontend pipeline (for more information, see here)
Accessibility (A11y) tests
Again, how big would the opportunity for a11y tests be? Some more rough estimates:
-
Time: A11y tests consumed 680K minutes per month. Assuming Bazel can cut this by 80% through caching (we were more optimistic about cache hit ratios here than for integration tests), we could save around 6.5M build minutes per year.
-
Money: Again, estimating each build minute costs an average of $0.018, a11y tests cost around 12.5K $USD per month. If we reduce this by 80%, we'd save around 100K $USD per year.
-
Number of steps: A11y tests executed 67145 jobs for 13947 commits. By executing 1 job per commit instead of 1 per page, we could reduce the number of jobs by 5x.
We started another working group to deal with hermetic a11y tests, and they quickly came up with a solution based on the existing work of other Jest tests running in Bazel.
FE Pipeline, and Bazel frontend integration and accessibility tests launch
These 3 projects were ready to go, but the launch was risky because we were:
- Grouping many steps across the frontend pipelines, affecting the DX (although it was similar to what we’ve done before with BE/ML Pipeline, so we had some confidence that it’d be OK).
- Decommissioning almost all sub-pipelines for page builds.
- Launching the new frontend integration and accessibility tests in Bazel.
- Fast approaching the code freeze period for Canva Create in Sept 2023.
Despite these risks, we were confident that it’d all work. We’d been running these changes in shadow pipelines for a long time and didn’t want to wait another month to deliver the improvements. At the very least, we wanted to learn what was wrong so we could use the code freeze period to fix what needed fixing.
We launched on 13 September 2023, only for 1 hour, to observe any issues. After not observing any significant issues, we launched permanently that afternoon.
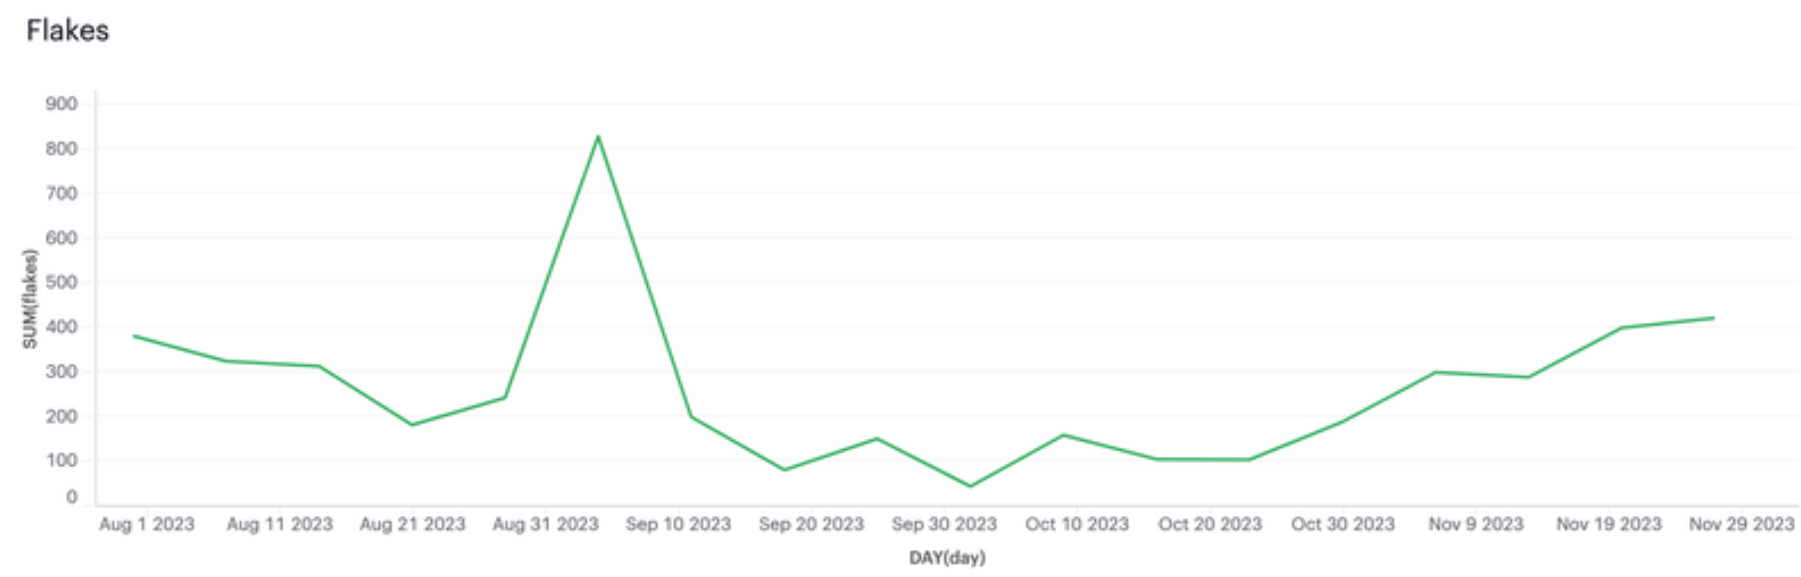
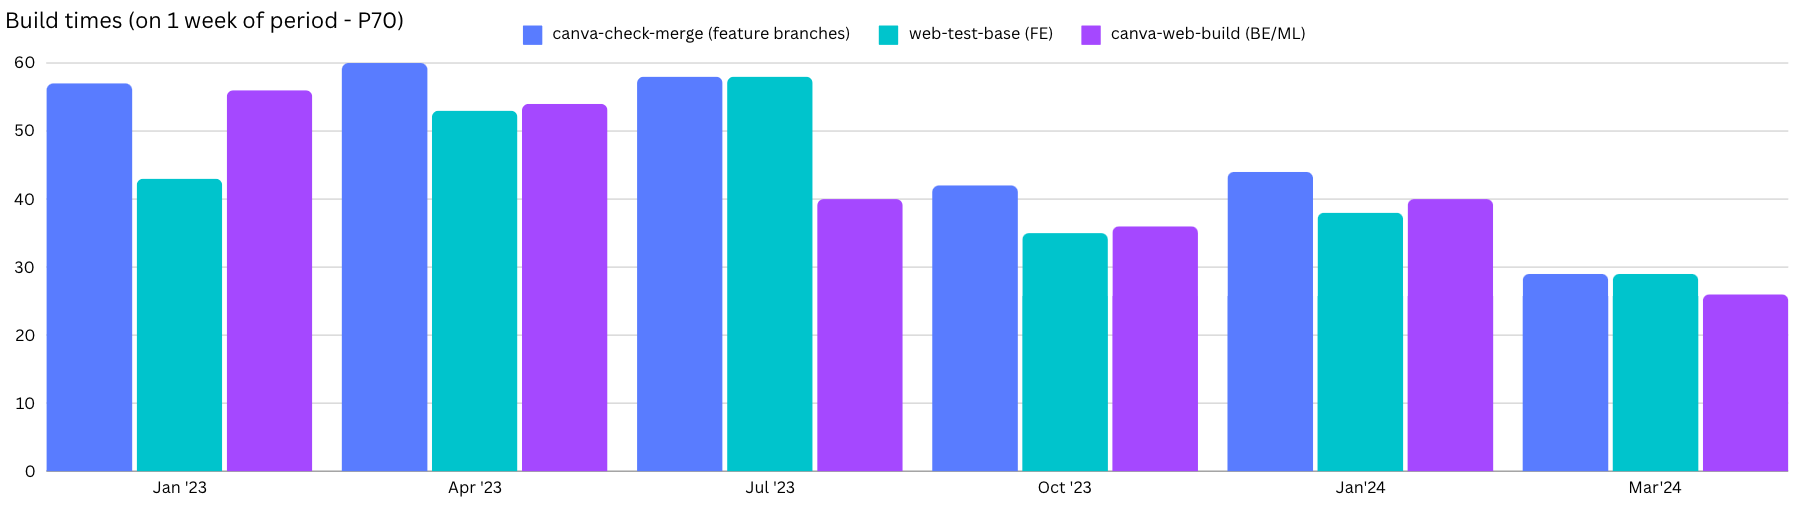
As shown in the following diagrams, the launch greatly impacted the metrics, as we predicted.
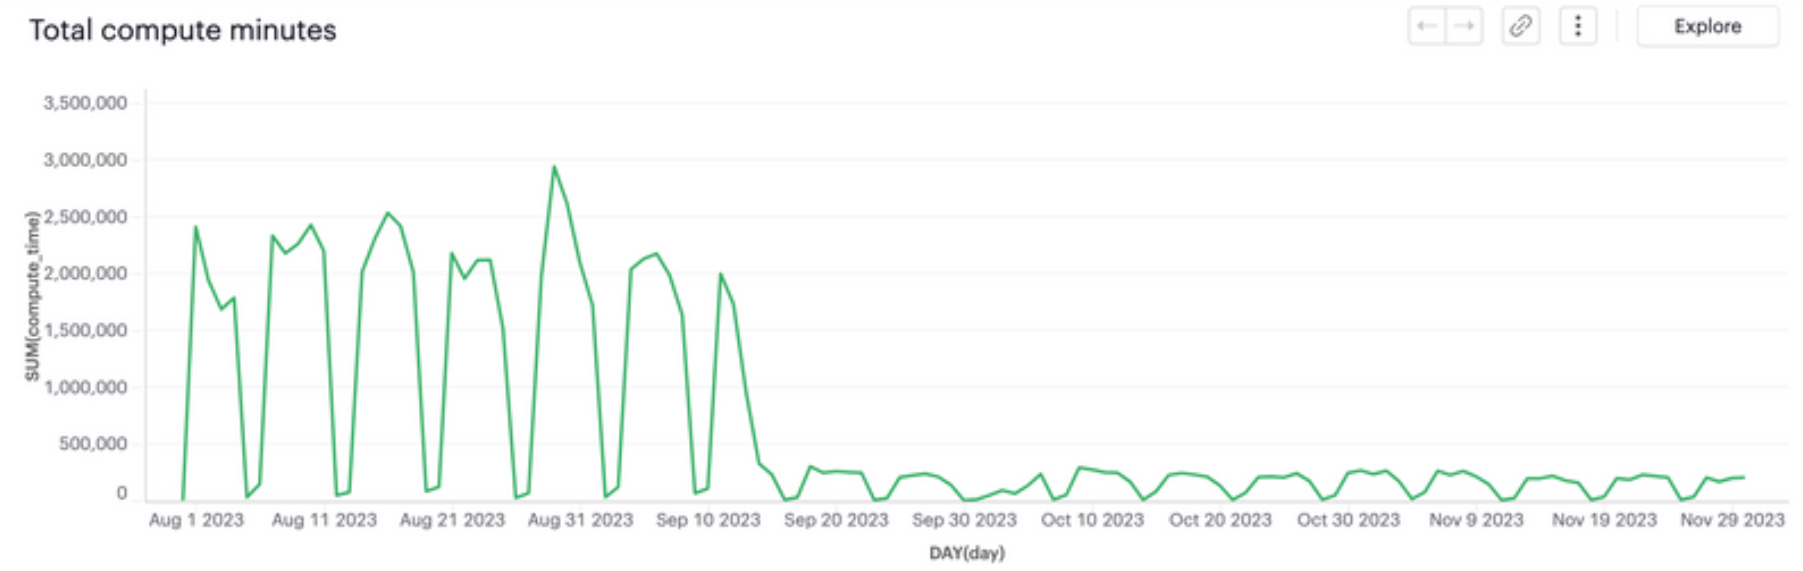
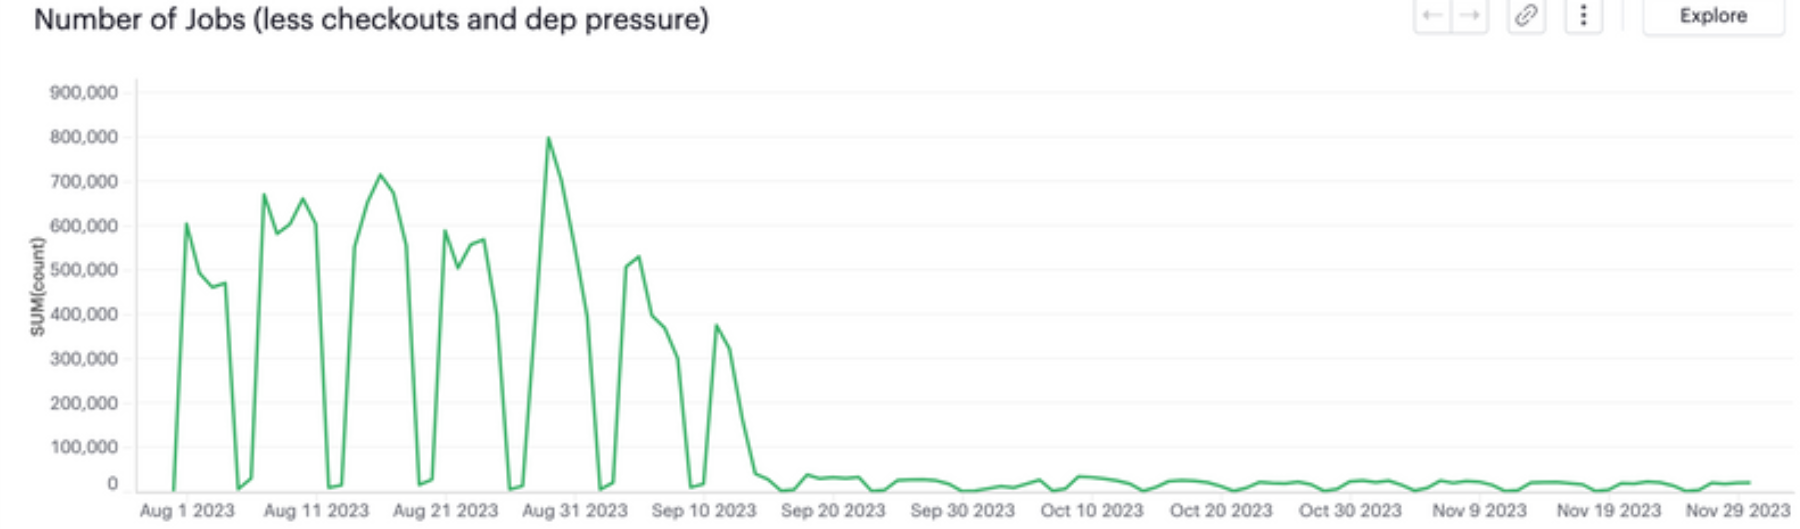
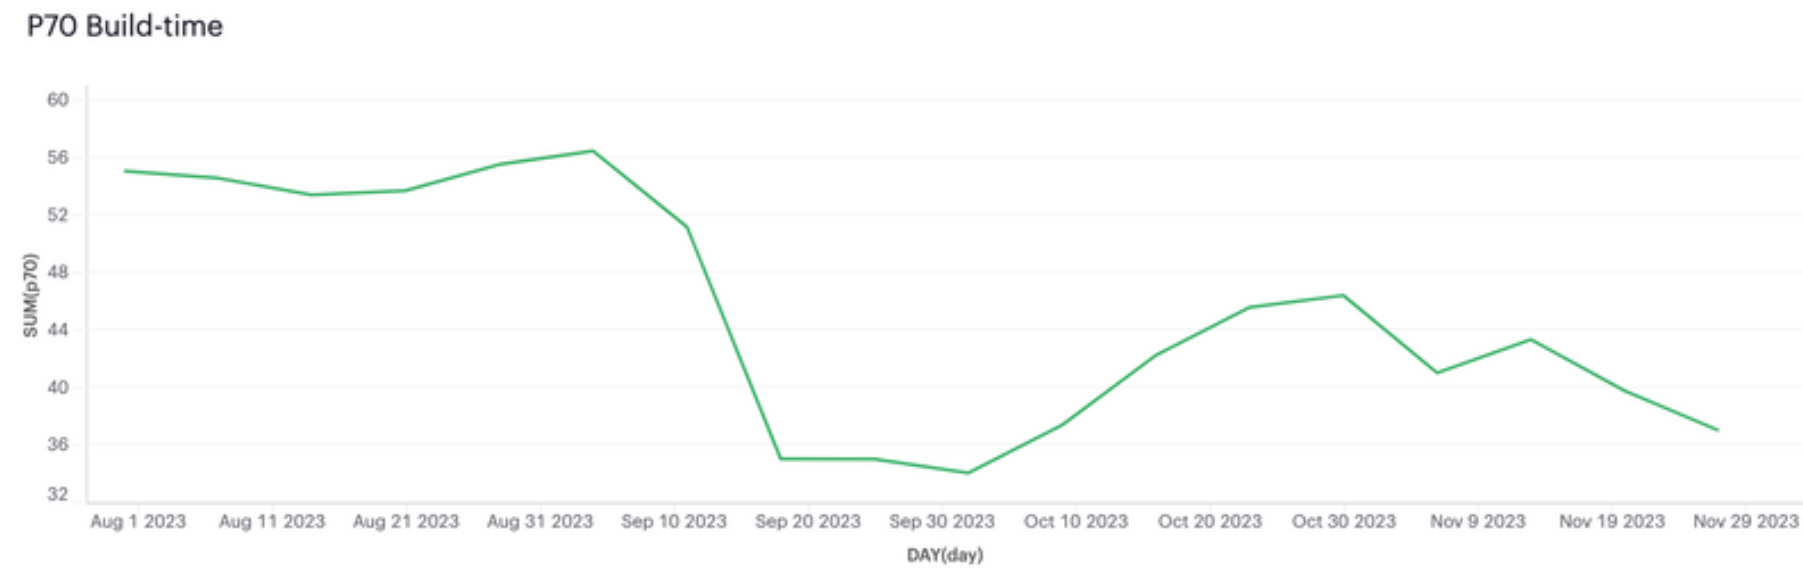
Note how we had regressions in performance around 11 Oct, and in flakiness around 25 Oct. As mentioned before, it’s hard to avoid them.
The changes we made weren’t trivial, but delivered big improvements. They made the frontend pipeline significantly faster and cheaper, and the code much simpler.
A faster pipeline generation
Removing bazel-diff and bazel query from the pipeline generation process reduced
the pipeline generation step to 2-3 minutes. However, 2 minutes on the critical
path isn’t great, and we knew we could do better.
Brainstorming the problem, we decided we could:
- Generate the pipeline statically instead of at job runtime.
- Avoid the git checkout and preparation time and cost.
- Move the git conditional evaluations to the job runtime.
- See how we could reintroduce
bazel-diffat runtime.
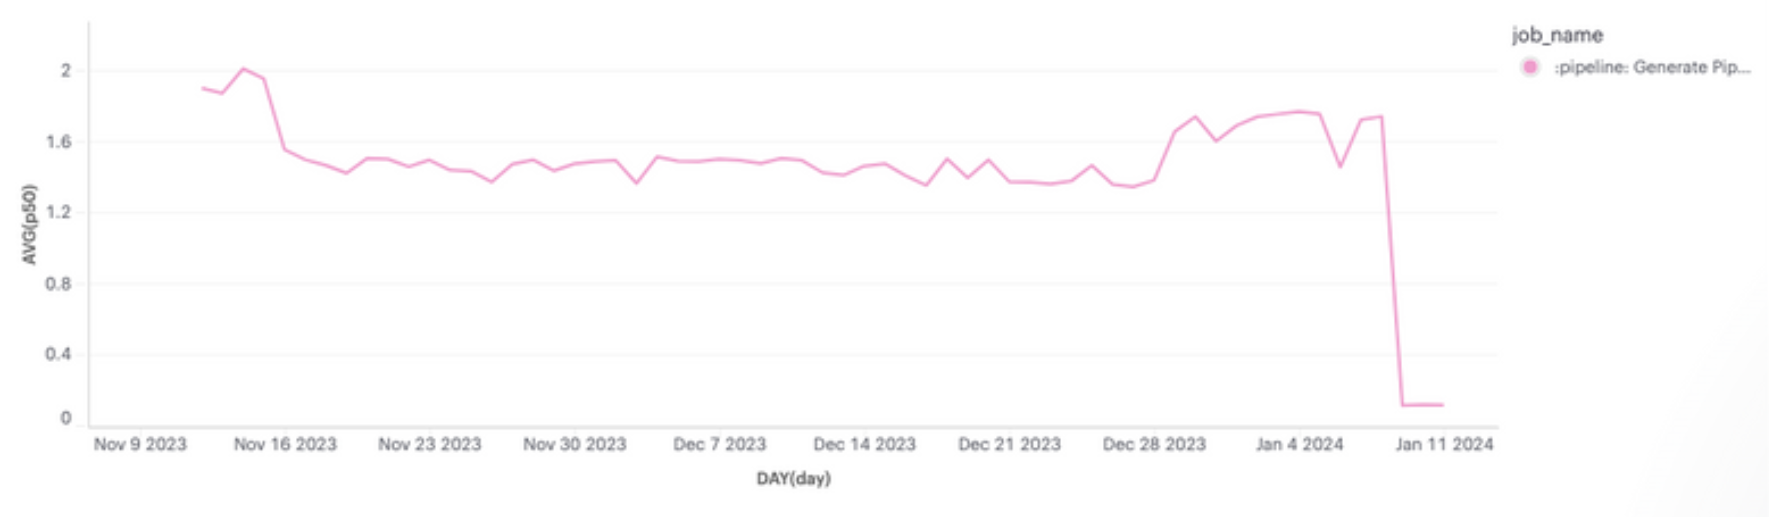
We quickly had solutions for points 1, 2, and 3, and on 9 January 2024,
we launched them for BE/ML Pipeline, and soon after, for FE Pipeline.
The following diagram shows the result.
For point 4, reintroducing bazel-diff at job runtime, we set up another POC. It
had dedicated instances to calculate the bazel-diff hashes (that is, a hash of
all inputs of each Bazel target) and upload them to a S3 bucket as soon as a
commit was pushed. At job runtime, we downloaded the hashes from the bucket to
see which targets were affected and needed to run. As a fallback, if the process
failed, we left Bazel to do its usual thing.
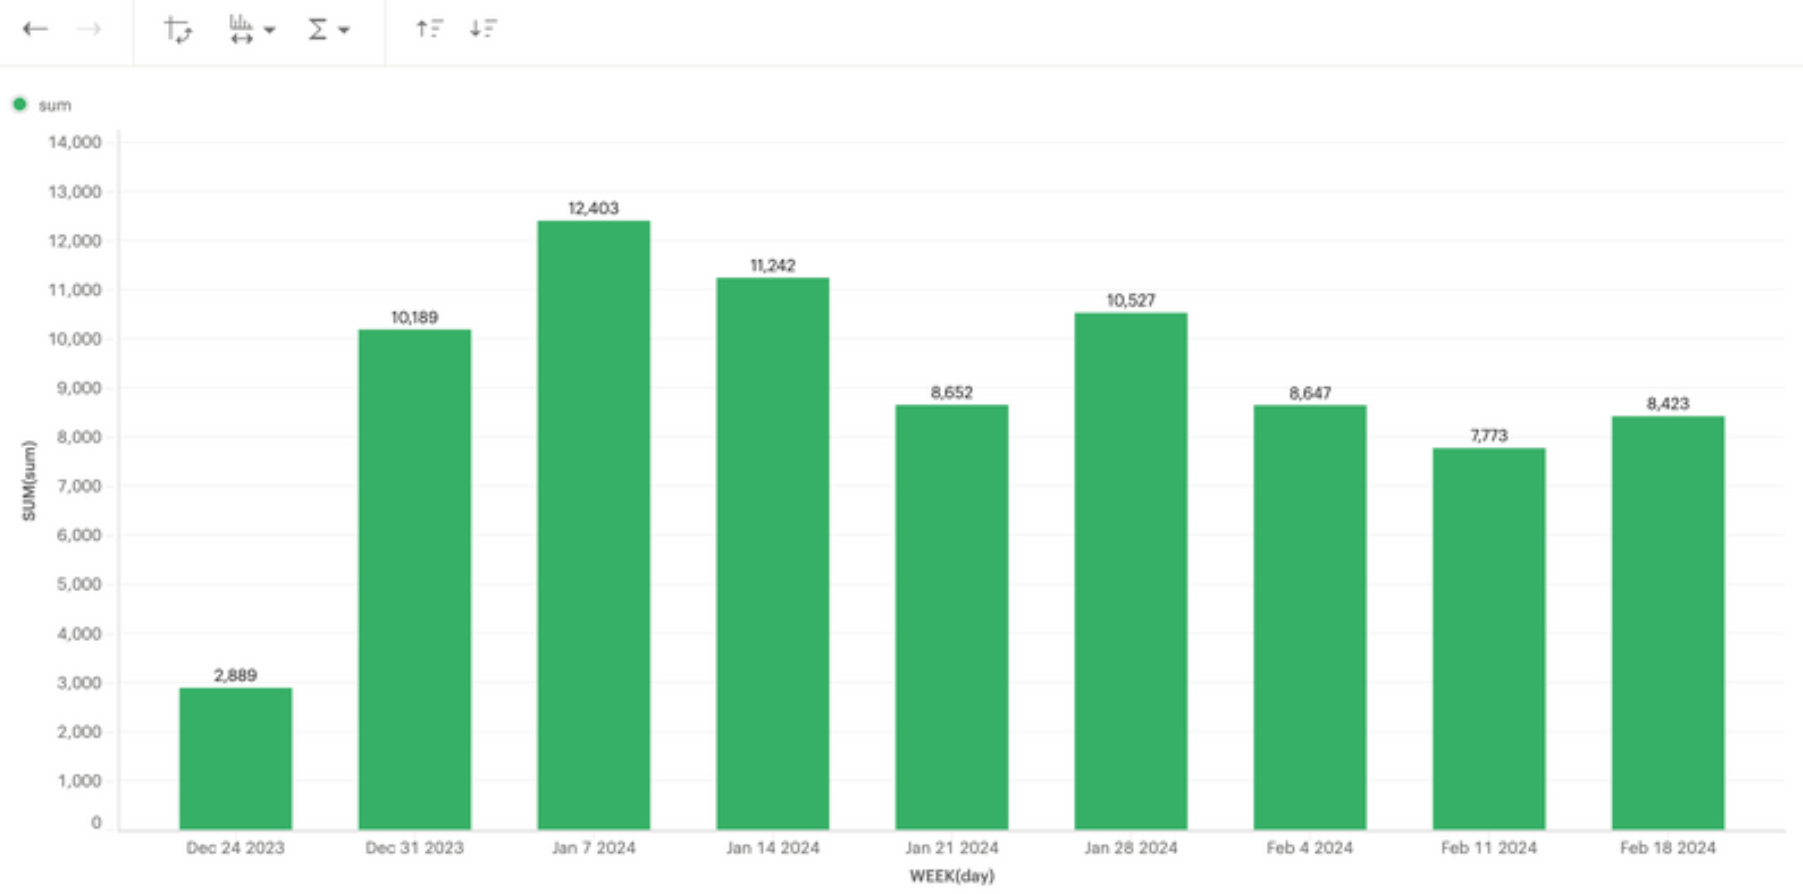
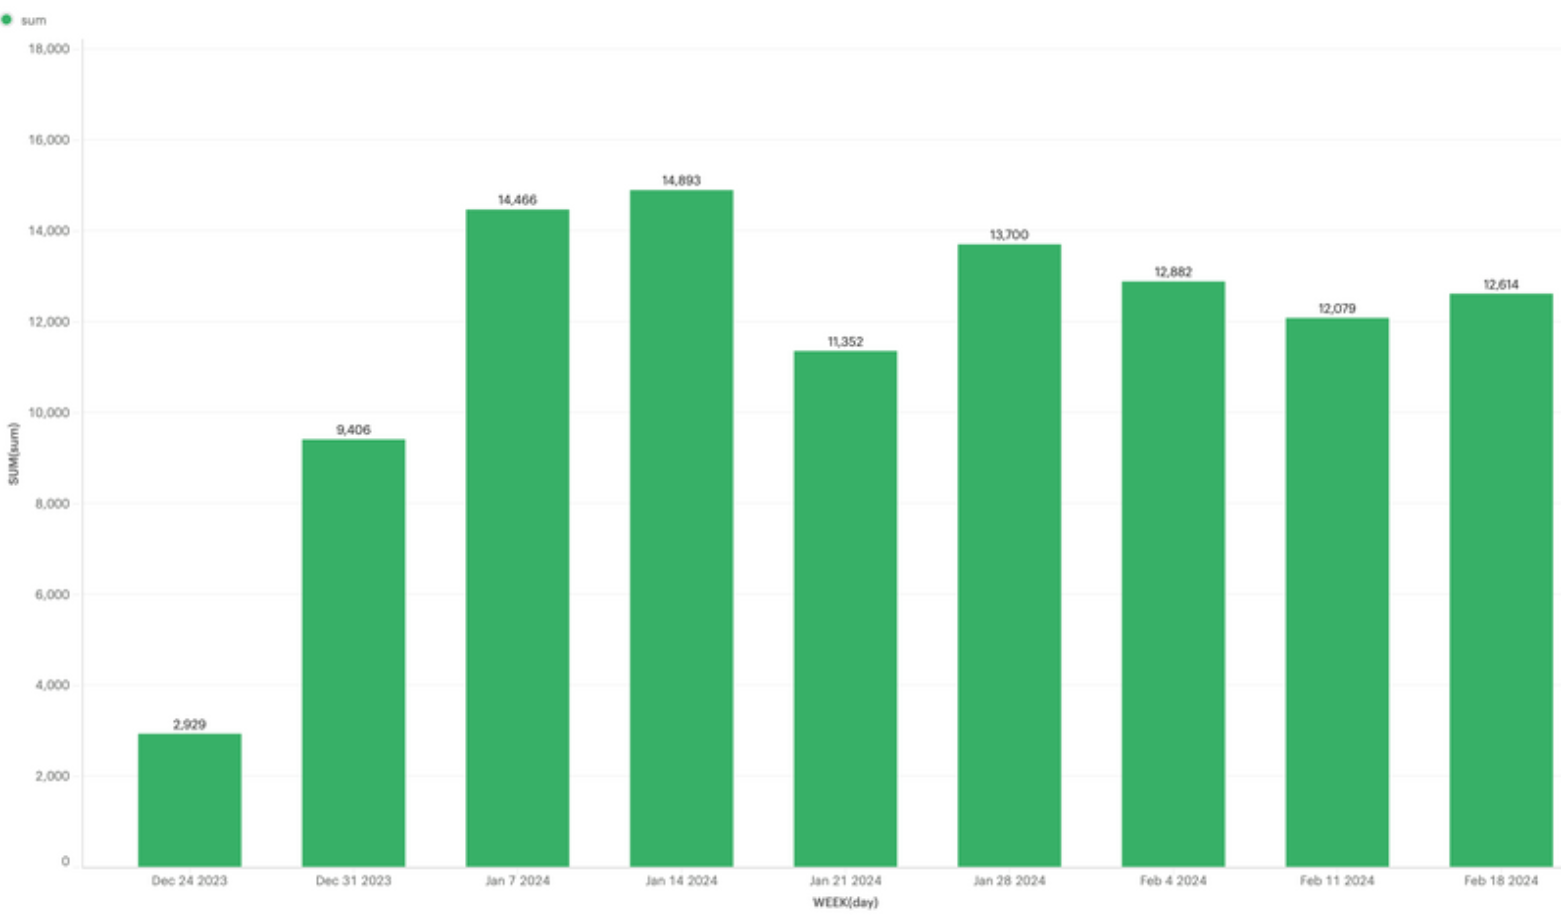
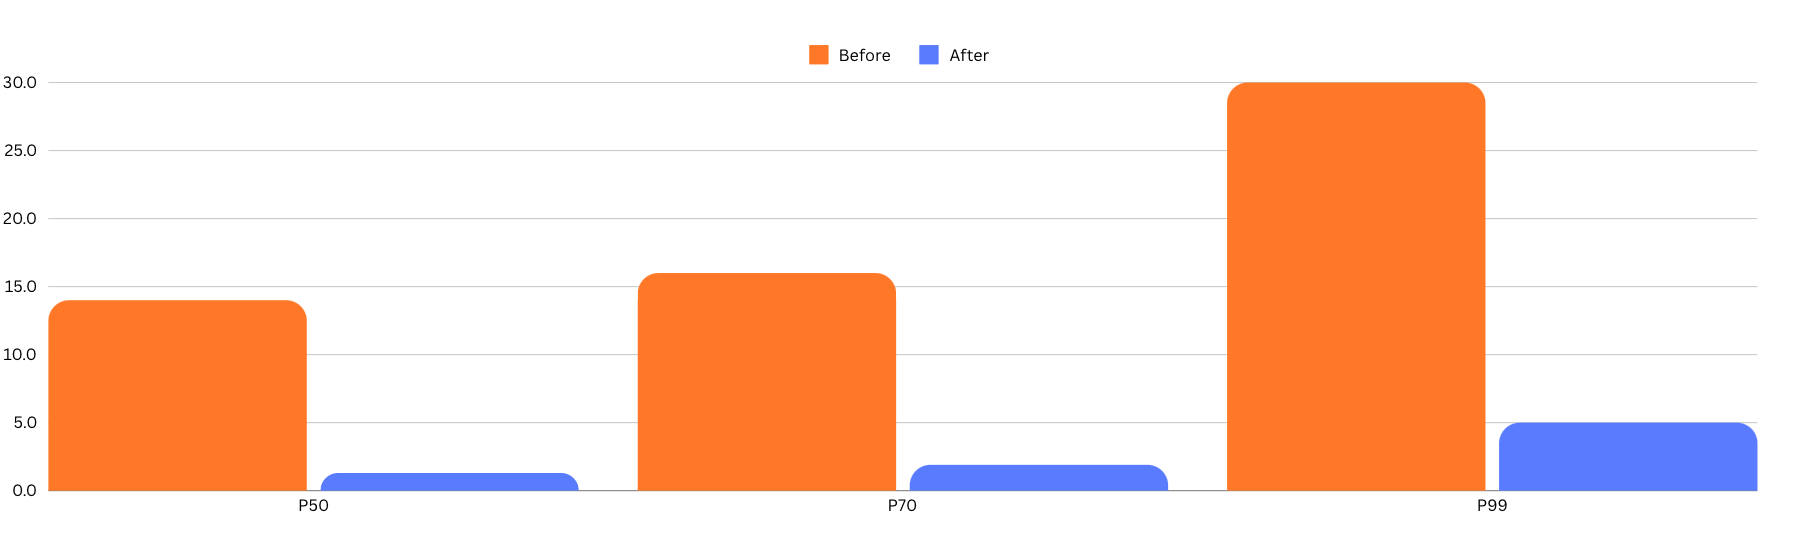
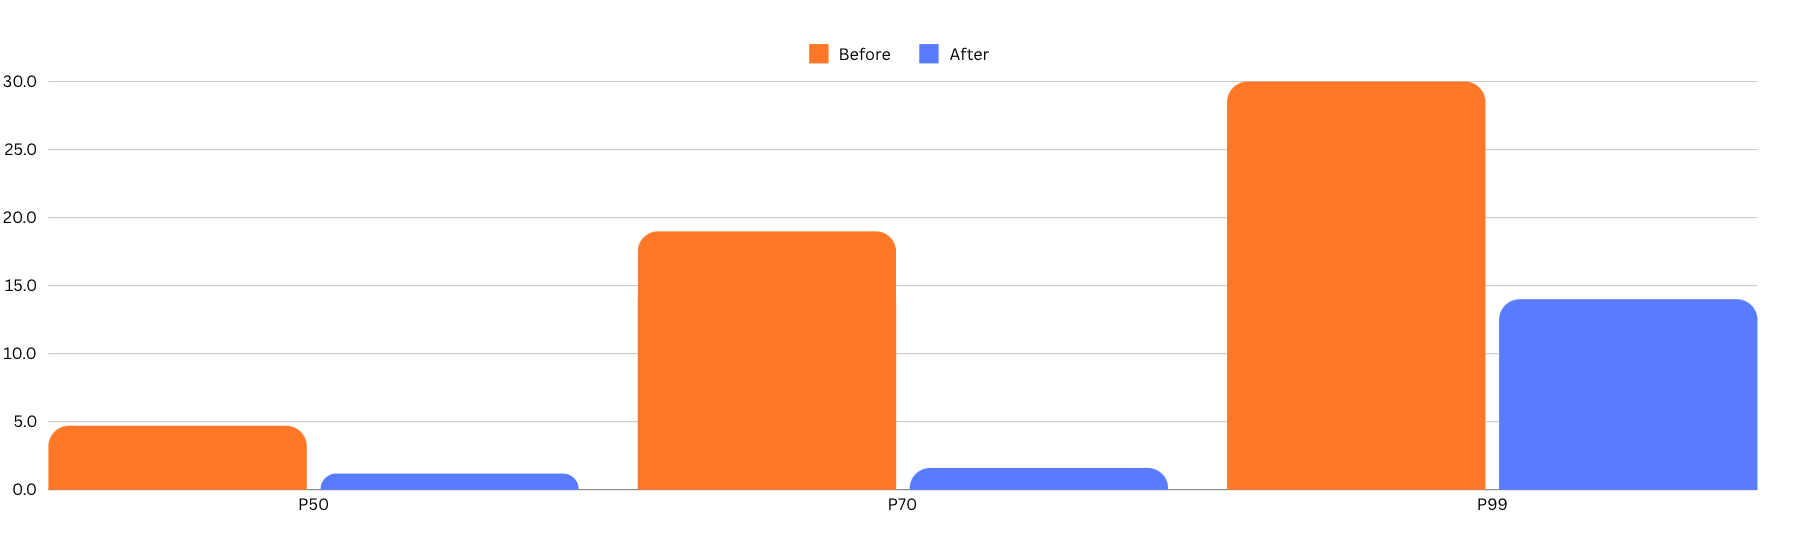
We launched on 31 January 2024, resulting in significant time and compute improvements. The following diagrams show the differences between January and February in our BE/ML Pipeline and FE Pipeline, respectively.
Refinements on our slowest steps: E2E and Editor integration tests
With all the previous changes, where were the biggest opportunities now? What CI jobs were most often on the critical-path?
We found that about 80% of the time, our E2E tests were on the critical path of our BE/ML Pipeline, while integration tests were on the critical path for our FE Pipeline.
We improved the E2E tests by fixing their CPU requirements and adding a more effective worker pool to execute them. This reduced E2E test runtimes by 7-10 minutes. We launched on 1 February 2024. The following diagram shows our results.
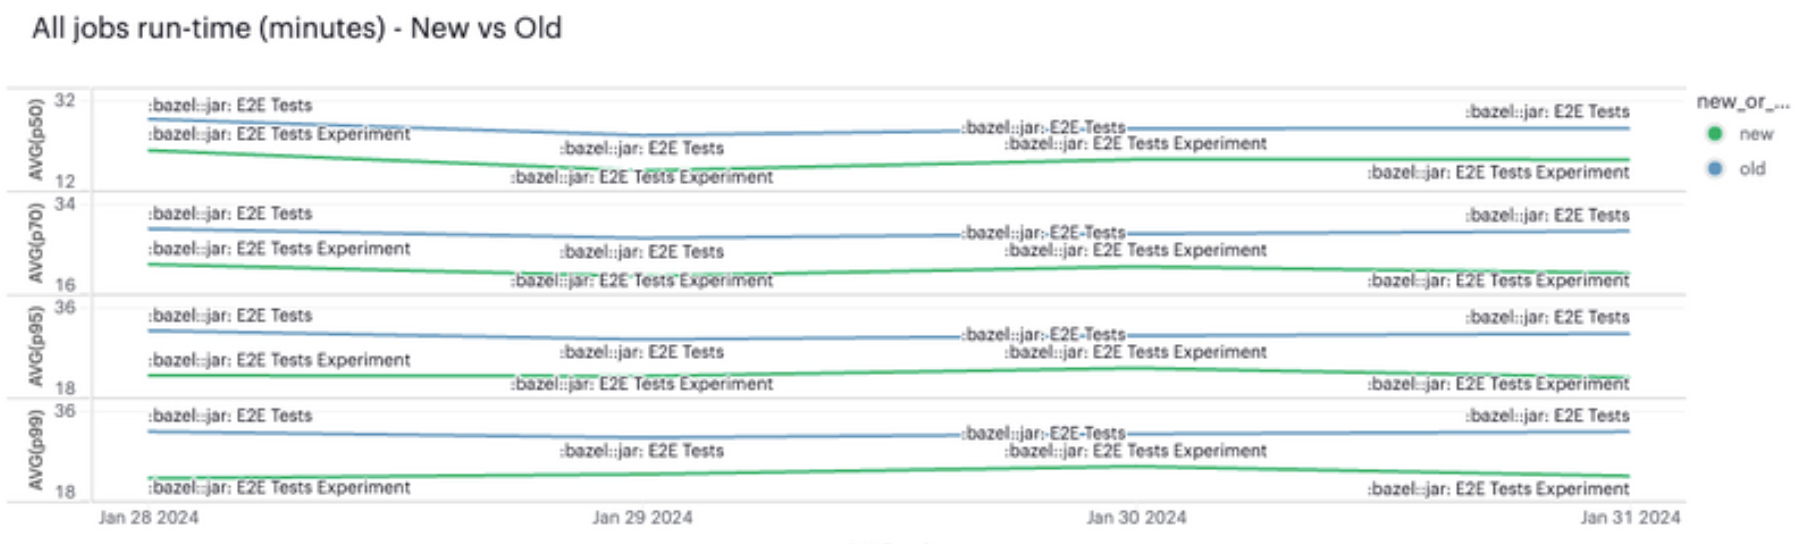
Our E2E test changes significantly improved the speed of our BE/ML Pipeline, putting the integration tests step of our FE pipeline on the critical path for most builds.
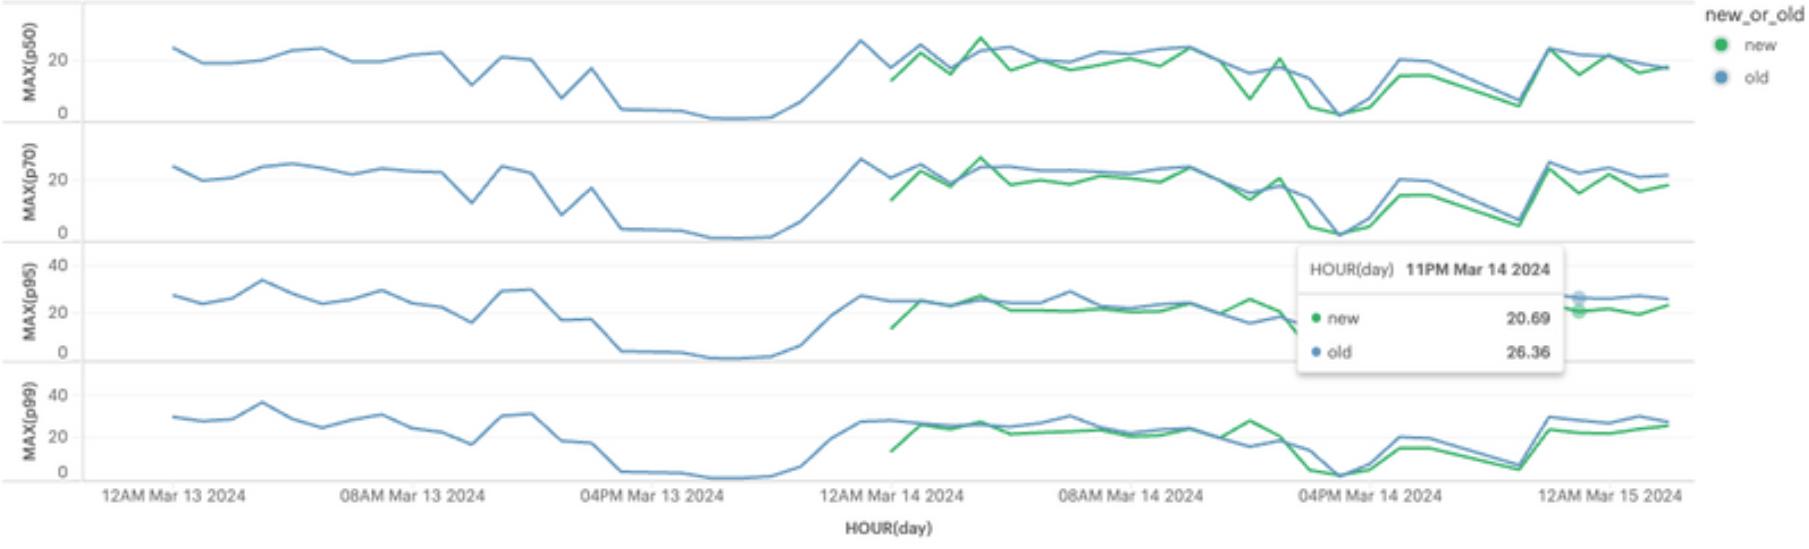
Another easy win was a new worker pool VM shape that had a better balance between
CPU, memory, and disk (from i4i.8xlarge to c6id.12xlarge).
We launched on 18 March 2024 and saved another 2-6 minutes.
Both changes were quick and easy refinements to deliver, but both delivered significant improvements to build times.
Making tests faster and more reliable
As mentioned before, the CI critical path is bound by its longest stretch of dependent actions. If one test consistently takes 20 minutes to execute and flakes, and has some logic to retry on failure, let’s say up to 3 times, it’ll take up to 60 minutes. It doesn’t matter if all other builds and tests execute in 30 seconds. That one slow, flaky test holds everyone’s builds back for up to 1 hour.
So, we wanted to improve and maintain test health (that is, flakiness and performance) across the codebase. Because it’s important to deliver incrementally, our plan was to reduce the worst case of test executions to less than:
- 10 minutes.
- 5 minutes (P95).
By manually disabling and helping owners improve slow and flaky tests, we reduced test actions taking more than 10 minutes to 3 minutes. In parallel, we’re also trying to automate the enforcement of test health across the repository.
All the changes made the build times incrementally better over 2023 and into 2024.
Every part of the experience matters. It takes a village.
If everyone is moving forward together, then success takes care of itself. - Henry Ford
This post tells the story of improving CI build times. However, build times are just a part of CI, and CI is just a part of the wider developer experience. While we couldn’t possibly mention everything that the Developer Platform group did to improve the DX in this post, we wanted to expand the scope and mention some initiatives that significantly improved step times.
These projects or launches might not have had a large or direct impact on build times because they weren’t on the critical path, but they still improved the CI DX by making the pass or fail signals of these steps faster.
Bazel Remote Build Execution (RBE)
Bazel can distribute its workload across a large cluster of executors. That way:
- Build actions from CI (and developer machines) are sent to a centralized build service, allowing us to distribute build computation across a farm of machines optimized to their workloads.
- Build inputs and outputs are co-located with build workers, allowing for faster I/O.
- We get better sandboxing and isolation (docker containers), allowing for a higher cache hit rate.
We’ve been exploring how to use RBE to improve our builds and tests for a while. We’ve enabled RBE for a few CI jobs already, with positive results. Here are the performance and costs results (P95):
- Typescript builds: 200% faster
- BE unit tests: 25% faster
- BE compile and pack: No change in performance, but reduced cost from $0.262 to $0.21 per build on average.
Improved agent warm-ups on AWS
Agent warm-ups were quickly solved using EBS snapshots to load caches into new agents, resulting in significantly shorter wait times:
- 75% reduction in peak wait times for all large agents (P95 down from 40 minutes to 10).
- 70% faster startup time in CI agents (Down from 27 minutes to 8).
This also saved a significant amount of money by reducing the extra warm-up minutes during which an instance is not doing CI work.
Linting improvements
We also significantly improved linting steps. We investigated the biggest opportunities and:
- Reworked the
dprintCI pipeline so it didn't need to waste time generating the list of files thatdprintcan format. - Rebuilt the
dprintsetup by building bespokedprintplugins for our use cases (for prettier and google-java-format). - Swapped out some inefficient formaters for open source alternatives (for example, Python’s
blackswitched toruff).
Together, these changes improved the dprint formatting job times substantially.
They also improved the IntelliJ Formatter for Java, by reducing the required format passes per format.
Many other improvements
We made many smaller improvements to CI performance, such as Bazel version updates, wrapper optimizations, step consolidations, Java, Node, and Python tooling updates, MergeQueue updates, and so on. And that’s not even touching on improvements to DX outside of the CI space. But we’ll stop here.
Acknowledgements
Many Developer Platform folks worked extremely hard to make things happen and to improve CI build and step times.
Many people and teams outside of the Developer Platform group also made significant contributions:
- Build and test owners: For striving to make their builds and tests amazing for every Canva engineer and helping us to continuously improve.
- Foundation groups and early-adopters: For giving us valuable feedback before we launched stuff.
- Cloud Platform: For your partnership in improving the CI and CD contracts and continuously supporting us with our cloud needs.
- Technical writers: For helping us make our writing (including this post!) clearer along the way.
- Everyone using Canva’s CI: For your patience when things were not great and for giving us encouragement now that things are improving.
Are you interested in optimizing our developer experience? Join us(opens in a new tab or window)!