Getting started
API reference
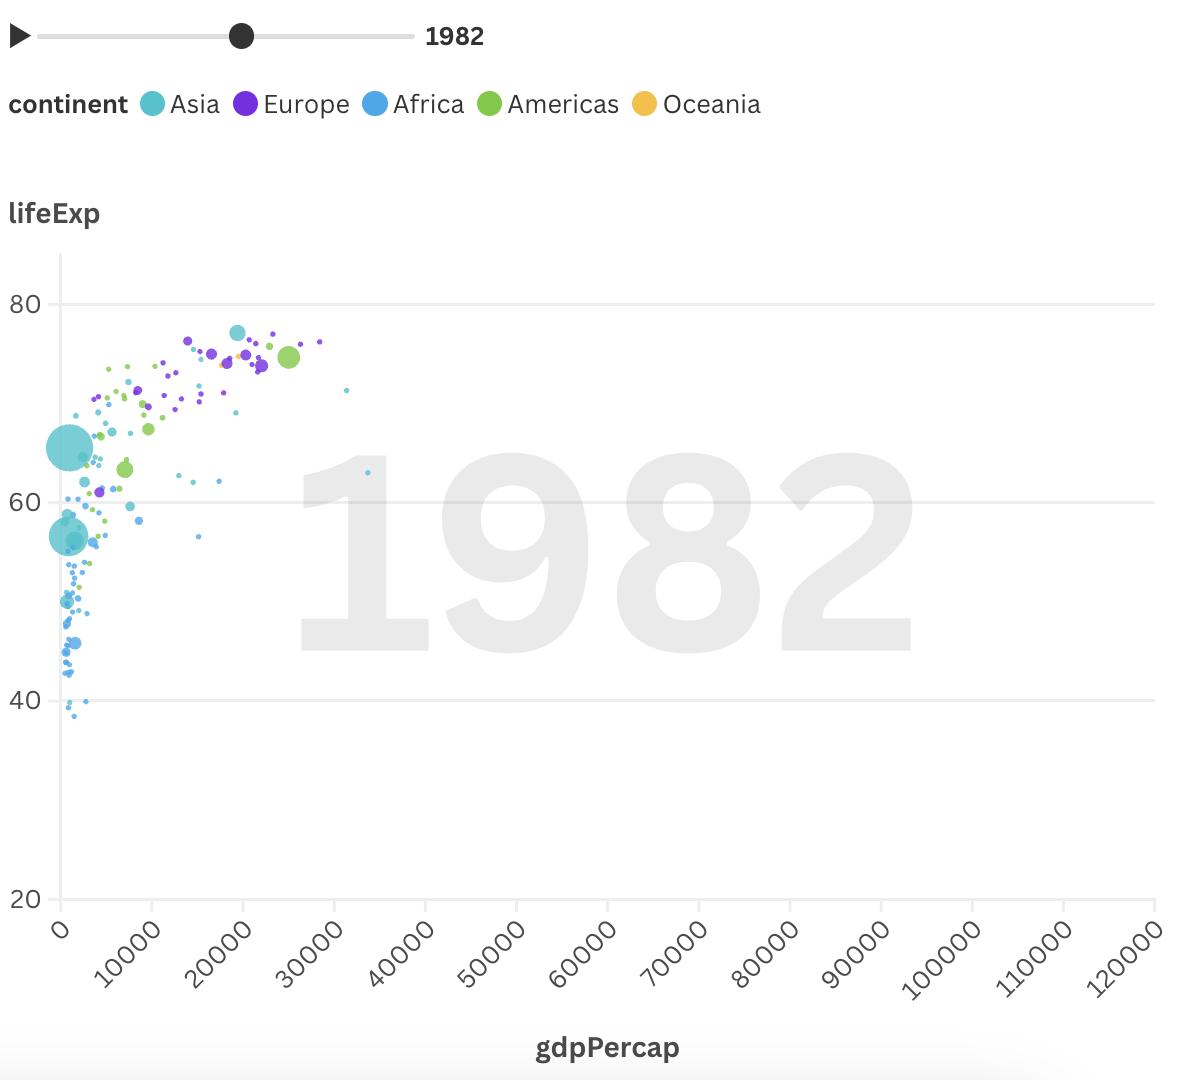
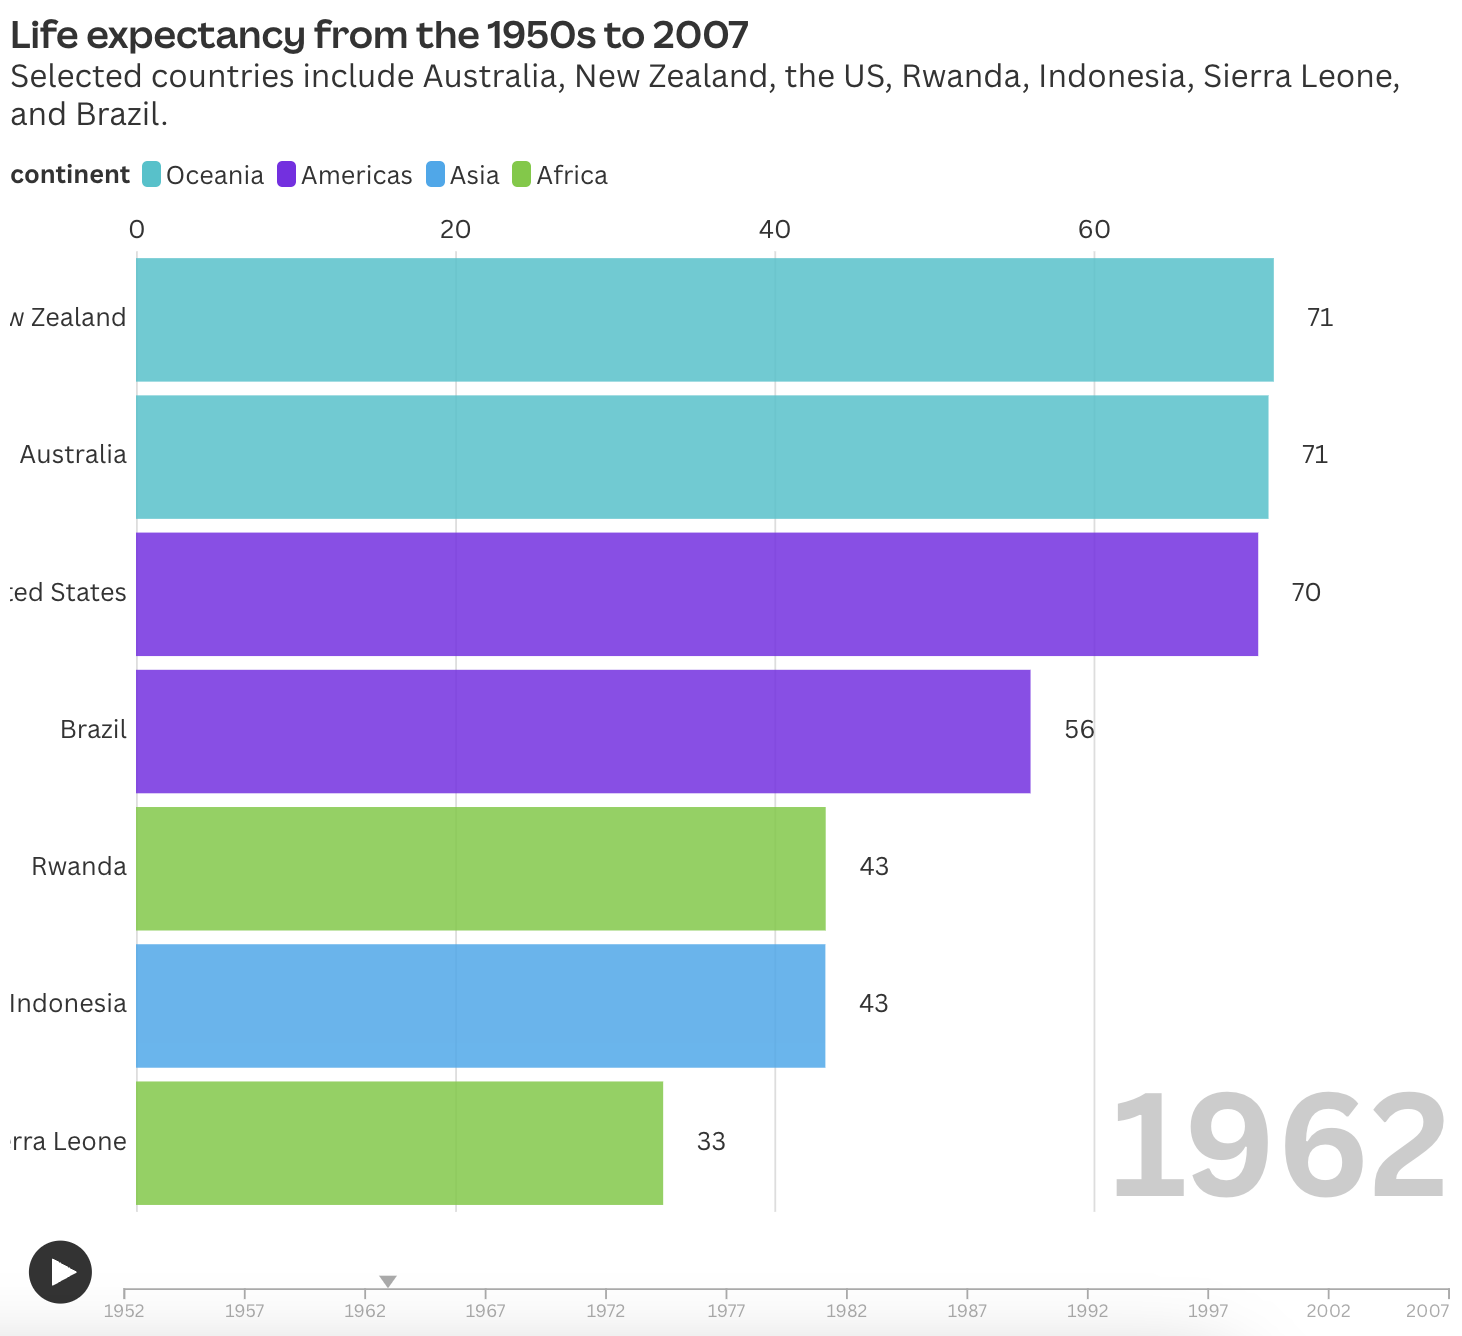
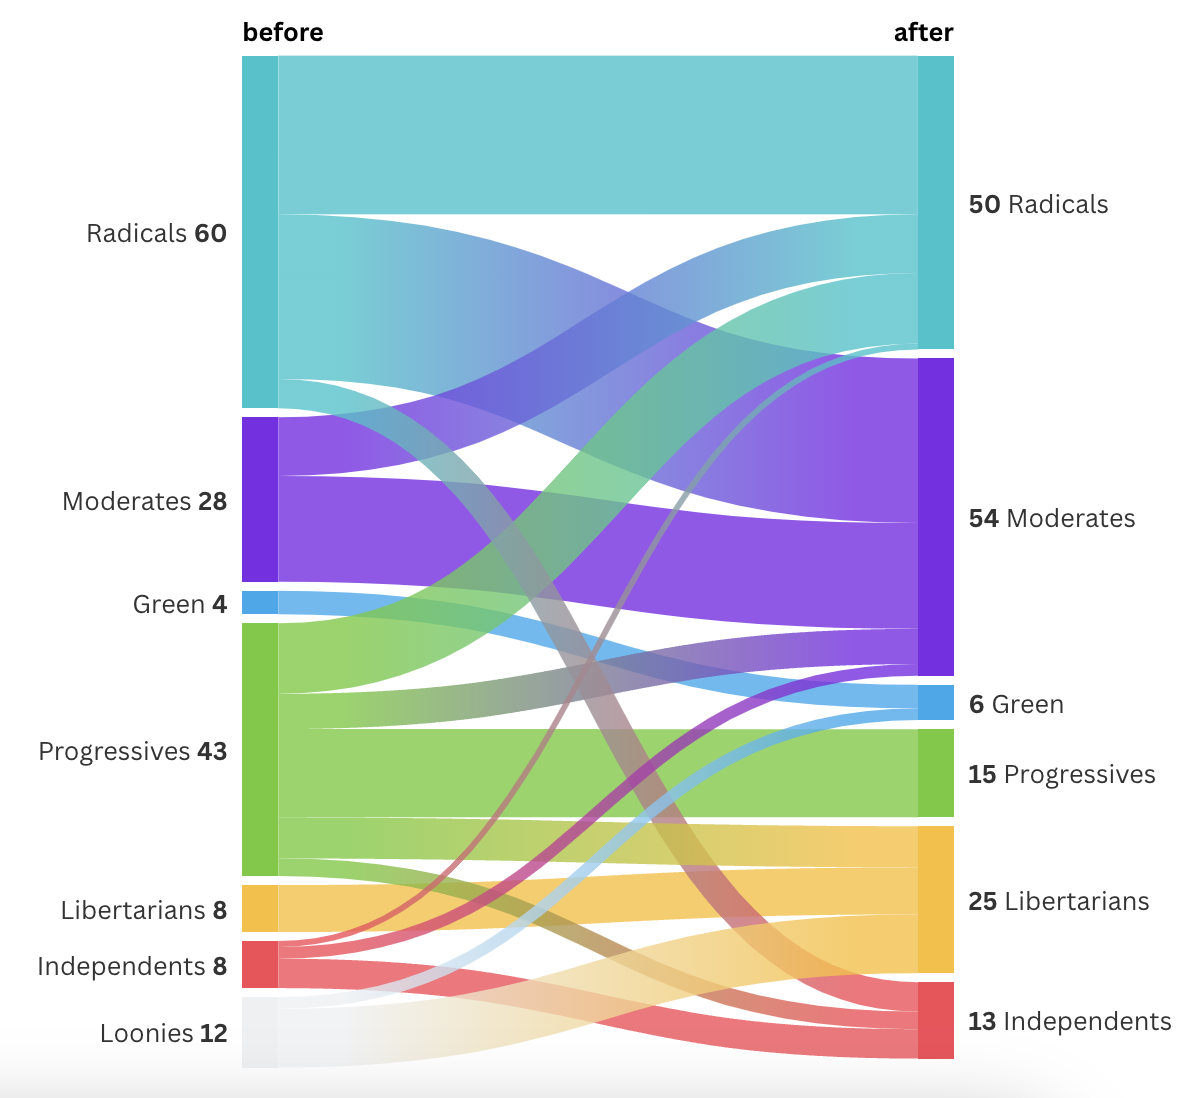
Flourishflourish-api-documentationgapminder
Binding additional data sources
Add extra details to charts
Flourish Charts
Flourish charts for Python and R.
Using Flourish Charts, data specialists can create interactive data visualization using Flourish, a data visualization platform, in a data science workflow.
 |  |  |
Install and set up
Flourish charts has two implementations in Python and R.
After installation, you can get started with some quick examples!
Examples
You can find example code snippets to help you get started on the Creating Flourish graphs page.
Any issues?
Log an issue in the Flourish charts GitHub repository(opens in a new tab or window).